
Sand dune migration and flux into the lower Helmand and Arghandab valleys
DOI:
https://doi.org/10.57035/journals/sdk.2024.e21.1085Keywords:
Aeolian sediment, sand dune flux, remote sensing, Helmand River, lower Helmand basinAbstract
In the Helmand/Sistan basin in south-west Afghanistan, aeolian sediment movement impacts the environment, irrigation canals, agriculture, and fluvial systems. The migration of large sand dunes into the Helmand and Arghandab rivers has a significant impact on the water resources providing livelihood for over three million people. A first step toward mitigating these impacts is to better understand sand dune migration. In this study, dune celerity and flux into the fluvial system are measured using PlanetScope Visual Ortho Scene satellite imagery. Two different time periods were used to quantify flux in five study sites of dune fields along 100 km of the Helmand River and 150 km of the Arghandab and Dori rivers. Results show diverse sand dune celerities with the fastest barchan dune movement south of Zaranj city. Sand dune celerity on the Helmand River right bank in the direction of flow is estimated to vary between 6.2 m/year to 103.1 m/year. The highest unit flux values of 250 m3/m/year occur in the lower Helmand basin. Much lower dune celerity values between 0.2 m/year to 2.9 m/year are calculated for the dune field on the left bank of the Arghandab and Dori rivers. The study also identifies the sensitive locations on the right bank of Helmand River in lower Helmand that may be used to plan sand dune stabilization measures such as mulching and Haloxylon species plantation that have been extensively practiced in the region.
Downloads
1. Introduction
South-West Afghanistan has one of the world’s most diverse aeolian sediment systems. The Helmand-Sistan plains contain 11 sand dune types due to the high spatio-temporal variability of wind speed and sand availability in the region. The largest ergs are the Margo and Registan deserts and the main driver of aeolian sediment transport is the locally known as Bade Sadobist Roza (the 120 days wind) (e.g., Heydari Nasab et al., 2018). According to measurement data made available by the Iowa environment mesonet (2022) the Sadobist Roza wind blows from north to south and then eastward between mid-May to mid-September with the maximum mean wind velocity of 6.2 m/s at Zabol (Iran) and the lowest mean velocity of 2.9 m/s in Spin Buldak of Afghanistan. The main driver of Sadobist Roza wind is the summer season pressure gradient between topographically high Turkmenistan and relatively low southern Afghanistan and Pakistan) (Whitney, 2006). Historic observations indicate the Bade Sadobist Roza blows almost continuously during the hottest month of the year (McMahon, 1906). Hurricane-force winds of 29-36 m/s are frequent. A maximum velocity of 53.6 m/s with an average velocity of 39.3 m/s for 16 hours was reported for a storm event in March 1905 (McMahon, 1906). The high-velocity winds in Sistan occur through the winter, from December to April, with frequent blizzards reported (McMahon, 1906).
There are three distinct modes of aeolian sediment influx into the lower Helmand and Arghandab valleys. (i) Fine-grained aeolian sediments derived from dust storms initiated both from the basin (Rashki, 2012) and the regional dust belt (the central Asian deserts in the north, and both Dashte-Lut and Dashte Kevir in Iran in the west (Shao et al., 2011; Vagara, 2012); (ii) aeolian sediment transport during the Bade Sadobist Roza, or “the 120-day wind”) (Tate, 1909); and (iii) sand movement by large mobile dunes and sand-sheets (e.g., Heydari Nasab et al., 2018). Tate (1909) described conditions of sand transport during one of 120-day wind south of Sistan, “It was impossible to keep lanterns alight, and after one or two narrow escapes from heavy falls everyone dismounted, for neither our animals nor ourselves were able to see the ground ahead, owing to the darkness and the sand which the head-wind blew into our faces”.
Dune celerity, direction, and deposition in the Sistan and Helmand basins follow the prevailing wind directions of north and north-west that pass through Hindukush and eastern Iran mountain pass valleys (e.g., Abbasi et al., 2019; Whitney, 2006) . Isolated barchan dunes observed in satellite imagery start to form in the immediate areas of active fluvial and lacustrine deposition. Further south, isolated barchan dunes merge into more complex dune fields that feature compound barchanoid and transverse dune forms. Sand dunes move in the eastward, and prevailing wind direction, but with lower celerities. McMahon (1906) reports that the intensity of sand dune movement in southern Sistan buried a large pool under 3 meters (10 feet) of sand in the Kila-i-Kohna village in three months, from June to September 1904. A recent field study in Iranian Sistan reports up to 79 m of dune movement during the 2017 Bade Sadobist Roza (May to September 2017) (Heydari Nasabet al., 2018).
A mineralogical and morphoscopic study of sand samples in Iran’s Sistan indicates that the main source of aeolian sediment is the local archaeo-alluvial sand particles (Zoraghiet al., 2019) (Figure 1A). Mineralogical and morphoscopic study of dune sediments in Neyatak corridors in Iranian Sistan shows medium sand (0.04 mm <D< 0.34mm) with D50 around 0.17 mm and mineral composition of quartz (48%), feldspar (6%), calcite (15%), gypsum (2%), lithic (26%) and others (3%) (Zoraghiet al., 2019). Aeolian sediment components are also found in lacustrine sequences of two 6.2 and 6.8 m cores in the Hamun Lake in the Iranian Sistan which is indicative of aeolian activities since the late glacial early Holocene (Hamzeh et al., 2017).
Aeolian sediment influx by sand dunes into the Helmand River occurs mainly in the lower Helmand basin, southeast of Dashti Margo. Minimal information is recorded for sand dune migration in this region, however, the aeolian sediment movement has significantly impacted infrastructure, agricultural activities, and human health. Strong sand and dust storms have blocked roads (Figure 1B) and irrigation canals (Figure 1C), encroached on residential areas, damaged agricultural land (e.g., UNAMA, 2003; Ramin, 2011) and led to air pollution, skin and eye irritation. The Zaranj-Delaram highway, Zaranj airport, and residential houses in the south of Zaranj city are often impacted by large sand dunes that block roads (Figure 1B), flights may be suspended, and health problems are documented (e.g., UNAMA, 2003; Ramin, 2011). Sand deposition and large dune advancement onto the fertile floodplains of the Helmand, Arghandab, and Dori rivers in this region have significantly impacted agricultural production in the Arghandab and lower Helmand Basin (Figure 1C). The Deshu district in lower Helmand is the most impacted by sand deposition in agricultural areas.
Figure 1. Aeolian sediment dynamic in south-west Afghanistan (A) land surface erosion by wind near Zaranj-Delaram highway (Photo by Rahimuddin Tayed) (B) sand dune blocking the Zaranj-Delaram highway (Photo by Ministry of Public Work of Afghanistan) and (C) dune migration onto the Helmand River at Lashkari irrigation canal intake in Nimruz (Photo by Mohammad Shafiq Wakil).
In the northern Registan sand sea, continuous expansion and contraction of aeolian dune fields cause Dori and Arghandab river channels to shift north as a result of constant aeolian sediment input (Al-Masrahy & Mountney, 2015). This study focuses on the influx of large mobile dunes into the Helmand and Arghandab rivers. The migration of large sand dunes into fluvial systems may cause water and sediment management problems in the recently built Kamal Khan dam and its irrigation canals. Kamal Khan Dam was inaugurated in March 2021 for flood protection and flow regulation to downstream water users and irrigation canals. The dam has significant socio-economical importance, providing water to approximately 164 ha of agricultural land in southwest Afghanistan. A significant concern is that sediment from large sand dunes may deposit into the river channels and become remobilized during flood events and transported to the Kamal Khan reservoir. This may lead to premature sedimentation of the dam and its irrigation canals.
Despite these various environmental and health implications, aeolian sediment mobility and flux of dune sediments into the fluvial systems has yet to be explored. This study (i) analyses sand dune migration near the Helmand, Arghandab, and Dori rivers in southwest Afghanistan and (ii) quantifies the aeolian sediment flux into the fluvial systems. A key aim is to identify regions with large sand dune sediment flux into the Helmand River for planning hazard mitigation measures. This study focuses on the sand flux transported by large sand dunes which is also termed as bulk flux. The contribution of free flux (grains movement saltation) may be significant to the total sand flux (e.g., Elbelrhiti et al., 2008), however, this is beyond the scope of this study.
Further, anthropogenic impact in this region can potentially change the aeolian-fluvial interaction from fluvial dominance to aeolian dominance. This region may be a unique example of how river damming can impact the aeolian-fluvial interaction.
2. Material and methods
2.1. Study area
The Helmand basin is categorized as hyperarid, except at the mountainous edges of the basin. The average annual precipitation for the region is approximately 72 mm in Zaranj, 75 mm in Lashkargah, and 141 mm in Kandahar (Favre & Kamal, 2004). Summer maximum temperatures exceed 50° Celsius in the Sistan region, but decrease near the mountainous edges of the basin (Favre & Kamal, 2004).
Aeolian sediment dynamics is the main landform driver in much of the lower Helmand Basin desert outside the Helmand Valley (Whitney, 2006). Aeolian sediment erosion and deposition processes generate landforms in the lower Helmand basin that are triggered by the Bade Sadobist Roza wind (May to September). The Bade Sadobist Roza wind blows from the northwest in the Sistan region before it changes direction to the east. This creates the observed sand dune field patterns shown in Figure 2. The greatest dune movement is identified in the Sistan region where the dune fields south of Zaranj start before tapering off toward the south and eastern edges of the basin.
The main source of sediment is from poorly vegetated and barren land, abandoned agricultural land, dry riverbeds (Heydari Nasab et al., 2018; Zoraghi et al., 2019) and shallow ephemeral lakes in the Helmand River delta, known locally as hamuns (e.g., Abbasi et al., 2010). Wind erosion may also bring sediment from mountains in eastern Iran (Huntington, 1905). Wind erosion in the Helmand River delta scours large hollows parallel to the wind direction that are up to 1.8 m to 2.4 m deep, 6 m to 9 m wide, and hundreds of meters long (Huntington, 1905). McMahon (1906) reported 6.1-meter hollows in the south-west of the Sistan basin that left isolated mounds (yardangs) of the original land surface. Recent field observation of a hamun on the Iranian side of Sistan shows an average erosion rate of about 31 kg/m2 (Abbasi et al., 2018). A more recent study in Iranian Sistan using high-resolution UAV images measured an average erosion rate of 20.1 kg/m2 from May to November 2019.
The first site presented herein is in lower Helmand and is located 28 km upstream of Kamal Khan Dam in the southern part of Dasht-i-Margo. This site is approximately 100 km long on the right bank in the direction of the flow of the Helmand River as shown in Figure 2. Three additional sites were selected in the lower Helmand basin for this study to understand the spatial variability of sand dune transport in this region. Site 2 is a barchan dune field, approximately 31 km2 on the northern edge of Dasht-i-Margo, before joining the large compound transverse dune fields. Site 3 is located where the dune fields in the south of Zaranj city begin. This site is approximately 200 km2. Site 4 covers about 1.4 km2 of exposed Helmand riverbed near the Khawbgah area close to the Iranian border. Site 5 is located in the northeast of the Registan desert where sand dunes may discharge into the Dori and Arghandab rivers. This site is approximately 150 km along the reaches of the Dori and Arghandab rivers in the north and north-eastern flank of Registan (site 5 in Figure 2).
Figure 2. Dune field in south-west Afghanistan. The five study sites in the lower Helmand basin (sites 1 to 4) and in Arghandab valley (site 5) are marked by polygons. The background image is a Sentinel 2 false color image compiled from imageries acquired between 16 February and 26 February 2022 (Drusch et al., 2012). The reddish areas show agricultural fields in the Arghandab and Helmand valleys.
2.2. Wind regime and energy environment
The main objective of wind regime analysis is to validate the sand dune transport celerity and flux based on the measured wind energy available for total sand transport. The flux calculated based on wind energy should exceed the estimated dune flux because only a fraction of the total wind energy is used for sand dune transport.
To establish a correlation between spatial variability of sand dune transport and dominant wind domains, wind velocity and orientation data from 11 stations in Afghanistan and Iran were analyzed (Table 1). The wind data has a temporal resolution of 1 to 3 measurements per hour recorded at 10 m elevation above the ground surface. Data were accessed from the Iowa State University Data Centre online site (https://mesonet.agron.iastate.edu/request/download.phtml?network=AF__ASOS; 14.07.2023).
| Stations | Duration |
|---|---|
| Sarakhs (Iran) | 22.08.2011-09.06.2022 |
| Zabol (Iran) | 01.01.1995-09.06.2022 |
| Zahedan (Iran) | 01.01.1995-09.06.2022 |
| Herat airport | 09.05.2005-12.08.2021 |
| Shindand | 24.01.2010-03.11.2014 |
| Farah | 14.01.2010-16.08.2019 |
| Delaram | 25.10.2011-05.07.2012 |
| Helmand | 26.06.2009-11.05.2016 |
| Kandahar/Qandahar | 01.01.2005-24.11.2020 |
| Spin-Boldak | 03.02.2010-03.06.2014 |
Wind data were analyzed following Fryberger (1979) to calculate dominant sand transport parameters such as drift potential (DP), resultant drift potential (RDP), and the ratio of RDP/DP. The wind and sand flux data were plotted. The drift potential (DP) volume and pattern are the most important parameters used to determine wind energy and sand mobilization capacity (Lancaster, 2009). According to Fryberger (1979) DP in vector units (UV) is given by:
(1) DP = V²(V-Vt)t
Where V is wind velocity at the elevation of 10 m above the ground surface, Vt is threshold wind velocity at 10 m to keep the sand in saltation, and t is the time duration over which the wind blew. The value of threshold wind velocity at 10 m can vary between 11-16 knots (Fryberger, 1979). A value of 12 knots (6.2 m/s) is adopted for this study as a critical wind velocity for dry sand transport.
The RDP is the net sand transport potential when winds blow from various directions and is calculated using the following equation:
(2) RDP = √(C²+D²)
Where C and D are drift potentials in y and x-directions, calculated by C=Σ(UV)sinθ and D=Σ(UV)cosθ. Recorded winds are regrouped into 16 sand transport directions and θ is the average orientation angle (angle of the midpoint of each wind direction class) measured clockwise from 0° or 360°. The resultant drift potential direction (RDD) represents the net trend of the sand drift (Fryberger, 1979) calculated from RDD=tan-1(C/D).
The unidirectionality index (RDP/DP) is a measure from 0 to 1 of wind directional variability. A value close to 1 represents a mostly unidirectional wind regime with a single dominant drift direction. In contrast, a value close to zero indicates a multi-directional wind regime with several significant drift directions (Fryberger, 1979).
The equation developed by Lettau & Lettau (1978) is used to estimate the total sand transport capacity as follows:
(3) q = [(C2ρ)/g] u*² (u*-u*t)
Where q is sand flow discharge (kg/m.s); ρ is the density of air (kg/m3); and g is the gravitational acceleration (m/s2), u* wind shear velocity in (m/s) and u*t is the threshold wind shear velocity assumed as (6.2 m/s). The value of C2 is estimated by C2=C1(ẟ/ẟ*)n , where C1 is a universal constant for sand (taken as 6.7), ẟ is grain diameter of mobile sand (d50) in mm is assumed as 0.25 mm (Zoraghi et al., 2019), ẟ* is standard sand diameter taken as 0.25 mm and n is an empirical constant taken as 0.5.
This analysis results in sand transport capacity (m3/m/year) for the wind observation stations in the study area. The sand drift potential, or transport capacity, can be used to interpolate the sand transport capacity of an area study where wind observation is absent. The result is then compared to outcomes of sand dune transport and direction derived from the remote sensing data analysis.
2.3. Remote sensing analysis of sand dune migration
Multiple methods of celerity analysis were utilized in this study based on previous work in dune field sites elsewhere (e.g., Ghadiry et al. 2012; Delgado Blasco et al. 2020).
2.3.1. Data compilation and preparation
PlanetScope Visual Ortho Scene (PVOS) imagery products by Planet Labs, Inc. captured by the Dove satellite constellation were used in this study. The imagery was geometrically corrected, orthorectified, color-corrected, and optimized for cartographic mapping and visualization purposes. PVOS imageries have three bands RGB (red, green, blue) with a spatial resolution of 3 m/pixel and daily temporal resolution. Daily records as early as January 2016 are available for this region (Planet Labs Inc, 2022).
PVOS imagery is captured as a continuous strip of single frame images, or scenes, with a nominal scene size of approximately 24 km by 7 km. Scenes were downloaded using Planet‘s Application Programming Interface (API) and were then compiled using Geospatial Data Abstraction Library (GDAL) raster programs gdalbuildvrt.py and gdal_translate.py python scripts. GDAL is a translator library for raster and vector geospatial data formats. The GDAL utilities gdalbuildvrt.py and gdal_translate.py were used to merge all the individual imagery pieces. The pixel values for the overlapping regions are averaged by modifying the pixel function in the virtual raster generated by gdalbuildvrt.py. The imagery data and their meta information used for this study are listed in Table 2.
| Dataset | Acquisition Date (dd/mm/yyy) | Acquisition time in UTC(hh:mm) | Sun azimuth( °) | Sun angle ( °) | Spatial Resolution (m) | Usage |
|---|---|---|---|---|---|---|
| PVOS by Planet Labs Inc | 11.01.2017 to 22.02.2017 | 05:32*05:47 | 145.4*144.4 | 28.1* 29.1 | 3.125 | Sand dune celerity calculation for the lower Helmand and the Arghandab Valley basins (site 5) |
| PVOS imagery by Planet Labs Inc | 21.01.2018 to 31.01.2018 | 05:53 | 143.5 | 31.9 | 3.125 | Sand dune celerity calculation for the lower Helmand basin(site 1, 2, 3 & 4) |
| PVOS imagery by Planet Labs Inc | 16.12.2021 to 24.12.2021 | 05:37* | 147.5* | 27.7* | 3.125 | Sand dune celerity calculation for the Arghandab Valley basin (site 5) |
| DSM by the Advanced Land Observing Satellite (ALOS) by Japan Aerospace Exploration Agency (JAXA) | 2009/2010 | NA | NA | NA | 5.0 | Sand dune size and flux estimation for the Arghandab Valley basin (site 5) |
| DSM by the Advanced Land Observing Satellite (ALOS) by Japan Aerospace Exploration Agency (JAXA) | 2009/2010 | NA | NA | NA | 10.0 | Sand dune size and flux estimation for the lower Helmand basin(site 1) |
2.3.2. Image processing in ArcMap
2.3.2.1. Image enhancement and focal statistics
A Percentage Linear Contrast Stretch was applied to the PVOS data to enhance the images. The images were further enhanced through focal statistical adjustment of the contrast. The Focal Statis-tic tool performs a neighborhood operation that computes a raster where the value for each output cell is a function of the values of all the input cells that are in a specified neighborhood around that location. This process improves the contrasts between dunes and non-dune surfaces by reducing any pixel noise around dunes.
The Focal Statistic function 1*1 was used to improve dune field delineation. The value of 1 means the neighborhood radius operation spans to one cell size around a target cell. In this operation, the pixel value of a target cell is replaced by the maximum pixel value of any cell in the neighborhood in a radius of one cell (3.125 m). The cell pixel value used is the image reflectance. Sand dunes have higher reflectance values than dune-free surfaces and, therefore are easier to delineate after this process. The radius is defined in cells and is measured perpendicular to the x- or y-axis. Any cell center encompassed by the circle or wedge will be included in processing the neighborhood. Image resolution and object size (e.g., sand dune, water body, and others) are key parameters used in the Focal Statistics function and neighborhood radius.
2.3.2.2. Reclassify
The Reclassify tool was used to separate the sand dune from sand sheets and plain terrain. The Focal Statistics analysis provides an image with ranges of pixel values for dunes and non-dune land surfaces. In reclassification, these ranges of pixel values receive either 1 (for dunes) or No-Data for non-dunes surfaces to separate dunes from the rest of the surfaces. If a range of values is to be reclassed, the ranges should not overlap except at the boundary of two input ranges. For example, two ranges of pixel values can be specified for a test region in site 1, such that values 215 to 250 are reclassified as 1 and values 175 to 215 as NoData. An input value larger than or equal to 215 will be assigned the value 1 in the output, and an input value that is less than 215, such as 214.99, will be assigned to NoData. By changing the pixel value ranges such as 225 to 250 for dunes and 175 to 225 for non-dunes, the dunes sizes are significantly underestimated and vice versa. A qualitative visual check was performed by superimposing the reclassified image over the original image to confirm dune sizes were accurately estimated.
2.3.2.3. Raster to polygon conversion
The identified dune areas in each site were polygonized. A raster dataset that contains features where each group of contiguous cells with the same values are converted into a polygon. Arcuate features are created from cell borders in the raster and are vectorized to a polygon feature output. As a result of this conversion, all cells encompassing a single dune are merged into one feature with polygon edges precisely representing the input raster cell edges. NoData cells in the input raster are left out of the analysis and do not become polygons in the output. The largest and smallest zones by calculated polygon area were filtered out because these zones depict other land surface features such as terrain relief, bushes, and water. The polygonization process does not impact the dune size if the smoothening function is not selected. The raster map of sand dunes from 2017, 2018, and 2021 was converted to vector format to calculate the migration rate (celerity) of the sand dunes (see Figure 3).
2.3.2.4. Polygon smoothening
The polygonisation process produces edgy and sharp-angle polygons. To improve the cartographic quality of polygons, the polygons are smoothened using Polynomial Approximation with Exponential Kernel (PAEK) with a tolerance of 10 m (3 pixels) to smoothen the edges. The choice of tolerance is important. A large tolerance value can significantly simplify the dune polygon geometry, and therefore, the dune area and centroid may drastically change. This can impact the accuracy of dune celerity and dune flux calculations.
2.3.2.5. Calculation of Polygon centroids
The calculation to determine the x and y coordinates of dune polygon centroids (Figure 3D) was performed by adding new fields (X_axis and Y_axis) in the attribute table of the polygons and subsequently calculating their values using the geometry calculation option.
2.3.2.6. Calculation of migrated distance (celerity)
Dune migration distance was calculated using dune centroid vector data from 2017, 2018, and 2021 exported as an ASCII raster grid. For every dune centroid in 2017, a paired dune centroid in 2018 and 2021 was automatically identified through a nearest-neighbor (NN) search algorithm (Figure 3D). This NN search paired centroids located within a 500 m search radius and in a 245 to 360 degrees clockwise arc. Once identified, the Euclidean distance between time-successive dune centroids was calculated using the Pythagorean theorem.
2.3.3. Estimation and validation of sand dune celerity
Dune migration rates, or celerity, are measured in meters per year and are calculated from the distance between dune pairs and known time intervals. Dunes in the lower Helmand were estimated in one year internally (2017 to 2018), and dunes in the Arghandab valley in a 4 year interval, from 2017 to 2021.
Calculated dune field movement is validated through manual checks at a sample site (Figure 3A). Image subtraction was used to calculate changes between PVOS imagery acquired in 2017 (Figure 3B) and 2018 (Figure 3C). Image subtraction defines areas where dunes migrated (Figure 3E). Migration distances are manually calculated and compared against migration characteristics such as distance, average celerity, and direction for automatically derived data. The average dune celerity, derived from the automated method for the sample area is estimated as 27.7 m/year. This is corroborated through manual measurement (Figure 3F).
Large dune movements with lower celerity values, however, are slightly underestimated by the automated method because their complex shapes change with time as a result of sand mass detachment. This can lead to smaller sand dunes and shorter distances between their centroids that reduce celerity values.
Figure 3. (A) A sample site shown by a white dashed rectangle; (B) and (C) respectively show dune polygons for the sample site in 2017 and 2018; (D) dune polygons, centroids, and migrated distance; (E) manual delineation of migrated distance using the image subtraction together with automatic dune celerity results, blue pixels (Figure 3E) define where dunes originated and orange pixels define the dune position after migration (Figure 3E); and (F) correlation between sand dune celerity values derived by automatic and manual delineation methods for the sample area.
The automatic dune celerity estimation method works well for barchanoid dunes with little or no geometry change. This is assumed to be either from the collision with other dunes or from a small sand-mass detachment. Similar inaccuracies occur for transverse dunes and compound transverse dunes. The manual post-processing of dune celerity was, therefore, necessary to correct the dune celerities. This was most prevalent in sites 1, 2, and 3 where dune collision and shape change were most common.
2.4. Estimation of sand dune flux or bulk flux
Individual sand dune sediment flux is calculated by multiplying the dune height with dune celerity. Dune height was estimated from the difference between a Digital Surface Model (DSM) of the dune fields, and a Digital Elevation Model (DEM) derived from the elevation of interdune areas. A 10 m and 5 m DSM used was generated from its original version processed in 10 m and 5 m grid spacing. The DSM was derived from data collected by the Advanced Land Observing Satellite (ALOS) in 2009/2010 and used for the Arghandab and lower Helmand basin study sites. The DSM was shared for this study by the Ministry of Water and Engery of Afghanistan (Figure 4A).
The DEM was generated from a Kriging Interpolation of points in interdune areas. These elevation points were manually inserted into the interdune regions, such as flat sand or clay sheets (Figure 4B). The Kriging interpolation method used estimates the elevation value at an unobserved location by a weighted linear combination of the values at surrounding locations (red points in Figure 4A). A DEM raster of all interdune terrain was created for all study sites.
To estimate the sediment flux, the elevation information of dunes is extracted from the DSM by subtracting the DEM from the DSM (Figure 4C). This process generates a DEM where dunes are removed from the original DSM. DSM data from the 2017-2018 period that aligns precisely with the sand dune celerity study timeframe are not available. We, therefore, assume that similar dune field topography persists in the study area compared to those identified in the 2009/2010 DSM data because the dune sizes for this specific wind energy environment do not significantly change within 10 years (e.g., Gadal et al. 2020) (see Figure 4A and D).
Sediment bulk flux in m3/year or ton/year can be calculated for any region by multiplying the sediment flux raster with the length of the dune field. The multiplication performs a cell-by-cell operation and provides a resultant unit flux raster in m3/m/year. This can be quantified using equation 4.
(4) Bulkflux=h∆L
Where h stands for dune height in (m), ∆ represents dune celerity in (m/year) and L represents the length of the dune field in (m) perpendicular to dune celerity. The values for dune celerity and dune field length L are estimated using the methods described above. For example, the estimation of sand dune sediment flux that reaches Helmand River floodplains or main channel can be calculated by multiplying the flux raster with the floodplain or riverbank length.
Figure 4. Procedure for estimation of digital elevation model of dune field using (A) DSM of a sample site (B) DEM of plain terrain surface generated from points elevations (red dots) using Kriging interpolation method (C) resultant DEM for the sample site dune field and (D) PlanetScope Visual Ortho (PVOS) imagery of the sample site. Red dots represent the sampling point for plain terrain elevation model generation.
It is not possible to extract dunes' height smaller than the minimum resolution of the DSM. This is notable for site 1. However, fields with dunes that are larger than the minimum DSM resolution are sufficient for this method. From our observations, dunes are larger near a river, therefore, sediment flux into the fluvial system is dominated by large dunes. Because of this, it is assumed that the inaccuracy in estimating small dunes' height might not significantly impact the overall accuracy of dune flux estimation. However, the 5 m resolution DSM for site 5 provides more accurate estimates of dune heights because site 5 contains large closed barchan dunes.
3. Dune movement in the Helmand basin
3.1. Sand dune celerity and spatial distribution
Histograms of sand dune celerity distribution and associated minimum, average, and maximum celerity statistics for all examined sites are shown in Figure 5 and tabulated in Table 3. The number of detected movements represents the number of barchan dunes in study sites 2, 3, and parts of site 1 where barchan dunes are present. However, for study sites 1, 4, and 5, a single closed barchan (in site 5) or compound transverse dunes (in sites 1 and 4) are sometimes divided into two or more parts, each with a distinct detected movement. The spatial distribution of sand dune movement for sites 1 to 4 in the lower Helmand basin is shown in Figure 6 and for site 5 in Arghandab valley in the northern flank of Registan desert.
Results for site 1 indicate that most sand dunes have a celerity between 10 m/year and 20 m/year (Figure 5A). Maximum celerity values are associated with small barchan dunes that detach from large compound transverse dunes in the Dasht-i-Margo dune field before joining the dune field on the right bank in the direction of flow of the Helmand River (Figure 6). Low celerity values represent dune migration inside Helmand River’s floodplain, where the presence of vegetation significantly reduces the wind velocity and thus dune celerity.
Site 2 consists of fast-moving, isolated small barchan dunes (surface area of 200 m2 to 4000 m2) with celerity values up to 156 m/year (Figure 5B) that migrate in a narrow corridor toward the larger dune field in the Dasht-i-Margo (Figure 6).
The sand dunes in site 3 originate in Afghanistan's Sistan region. For this site, barchan and compound transverse dunes in the east and southern of Zaranj city (Figure 6) have celerity values of up to 191 m/year (Figure 5C). The lower celerity values correspond to compound transverse dunes and higher celerity values correlate with isolated barchan dunes that appear to migrate faster because of the highest RDP zone in the lower Helmand basin and unvegetated flat topography.
The compound transverse dunes on the exposed Helmand riverbed in site 4 indicate lower celerity values, mostly between 13 m/year to 19 m/year (Figure 5D), despite being located in a high-wind environment. The main reason for low celerity is probably fluvial water inundation of the dune field. Sentinel-2 imagery corroborates this; site 4 was partially inundated from February to June 2017). High substrate moisture content directly reduced aeolian activity and also facilitated vegetation growth through the dry period, stabilizing sand dunes and reducing their mobility.
Consequently, site 5 has the lowest celerity values compared to all other sites (between 0.8 m/year to 1.5 m/year) (Figure 5E). The variability is predominately controlled by topography. Regions confronted directly by mountains (Hindukush in the north and Suliman in the east of Registan sand sea) have lower celerity while those on the mouth of Arghandab valley have slightly higher celerity values.
| Sites | 1st quantile (Q1) | Median | 3rd quantile (Q3) | Interquantile (IQR) | Standard deviation | Minimum | Maximum | Average |
|---|---|---|---|---|---|---|---|---|
| Site 1 | 13.5 | 15.6 | 18.7 | 5.3 | 7.2 | 6.2 | 103.1 | 17.3 |
| Site 2 | 54.1 | 67.7 | 86.9 | 32.8 | 27.9 | 16.7 | 155.6 | 70.8 |
| Site 3 | 41.0 | 52.3 | 65.3 | 24.3 | 21.4 | 15.4 | 191.2 | 55.3 |
| Site 4 | 15.0 | 16.7 | 18.1 | 3.1 | 3.0 | 11.1 | 27.8 | 17.1 |
| Site 5 | 1.0 | 1.2 | 1.5 | 0.4 | 0.3 | 0.2 | 2.9 | 1.3 |
Figure 5. Histograms of sand dune celerity distribution for study sites 1 to 5 respectively in (A) to (E).
Sites 1 and 5 are particularly interesting due to their potential interaction with the fluvial system. Celerity decreases toward the Helmand River because Helmand River floodplain vegetation strongly suppresses wind velocity. Celerity values range from 6.2 m/year to 103.1 m/year with an average value of 17 m/year. Dune field movement is predominantly in the southeast direction (300 to 330 degrees). The higher celerity values occur in the small corridors of barchan dunes between compound transverse dunes fields. These corridors of barchan dunes often occur outside the river region and are not immediately surrounded by compound transverse dunes, so wind transport is more effective at moving these barchan dunes.
Immediately south of Zaranj city, the celerity of compound barchanoid dunes ranges from 15.4 m/year to 191.2 m/year. Barchan dunes further south of Zaranj reach a maximum celerity of about 155.6 m/year before merging into large compound transverse dune fields. Exposed riverbed sediments are also transported by wind in the opposite direction to fluvial sediment transport. A celerity of 11.1 m to 27.8 m/year is estimated for a section of the Helmand River in the Khwabgah region near the border with Iran.
Figure 6. Spatial distribution of sand dune celerity in lower Helmand basinBackground image: Sentinel-2 natural color image compiled from imageries acquired between 16 February and 26 February 2022 (Drusch et al., 2012).
3.2. Sand dune celerity-size relationship
It is difficult to establish the relationship between dune celerity and dune height for most of the study sites because of a lack of high-resolution elevation data. However, the PVOS (3.125 m) imagery resolution (Figure 7A) allows for the measurement of barchan dune widths with sufficient accuracy to determine the dune celerity-width relationship (Figure 7B) for barchan dunes in sites 1 and 3. A power-law function with R2 values of 0.85 and 0.81 is found to best describe the relationship between barchan dune celerity and dune width for sites 1 and 3 respectively. Similar power-law relationships are described in previous studies (e.g., Elbelrhiti et al., 2008). The only field observations in the region are from the Iranian Sistan (Negaresh & Latifi, 2008; Heydari Nasab et al., 2018) across the border which is located in the same energy environment as site 3. The observation data lies below the data of this study for site 3 because the observations from Iranian Sistan are for a much shorter period of three and five months during Sadobist Roza (120 days wind). The extrapolation of these field observations for one year can result in better agreement with the results of this study.
Figure 7. (A) An example of dune celerity variation with dune size (width) for site 3 derived by superimposition of January 2017 imagery over that of January 2018 (B) relationship between barchan dune celerity and width in sites 1 and 3 (one-year celerity) together with two sites from Iranian Sistan (five- and three-months dune celerity observations). Source of data from Iranian Sistan: Negaresh & Latifi, (2008) and Heydari Nasabet al. (2018).
Wind energy impacts both sand dune celerity and geometric dimensions. Sand dunes in high-energy environments tend to have lower heights, while those in lower-energy environments develop greater heights. 10 m and 5 m DSM data were used for site 1 and site 5, respectively, to estimate dune size (Figure 8). A 6 large number of longitudinal axis sections for barchan and compound transverse dunes. Measured heights range between 1 m to 12.6 m with an average dune height of 5.2 m. Similar height values are also reported for barchan dunes from two sites in Iranian Sistan that range from a minimum of 1 m to a maximum of 5.8 m, with a slightly larger wind energy environment than site 1 (Negaresh & Latifi, 2008; Heydari Nasab et al., 2018).
Figure 8. Normalised dune profiles or dune height information derived from 10 m resolution DSM along the longitudinal axis of dunes for site 1.
In the Registan region, dune height ranges from 10 m on the banks of the Arghandab River and up to 15 m on the banks of the Dori River in the northeast of the Registan desert. Dune profiles indicate that these heights are a product of dunes superimposed over larger dunes (Figure 9). The profiles also indicate dunes on the Arghandab River bank are smaller compared to dunes on the Dori River banks in the east of the Registan desert.
Figure 9. Sand dune profiles along the Arghandab River bank (A, B, C, D) and Dori River bank (E, F, G, H). All profiles are oriented parallel to the wind direction except profiles e and h. These are oriented perpendicular to the main wind direction. The red circles show two superimposed smaller dunes over a larger dune shown in blue.
3.3. Sand dune flux into Helmand and Arghandab rivers
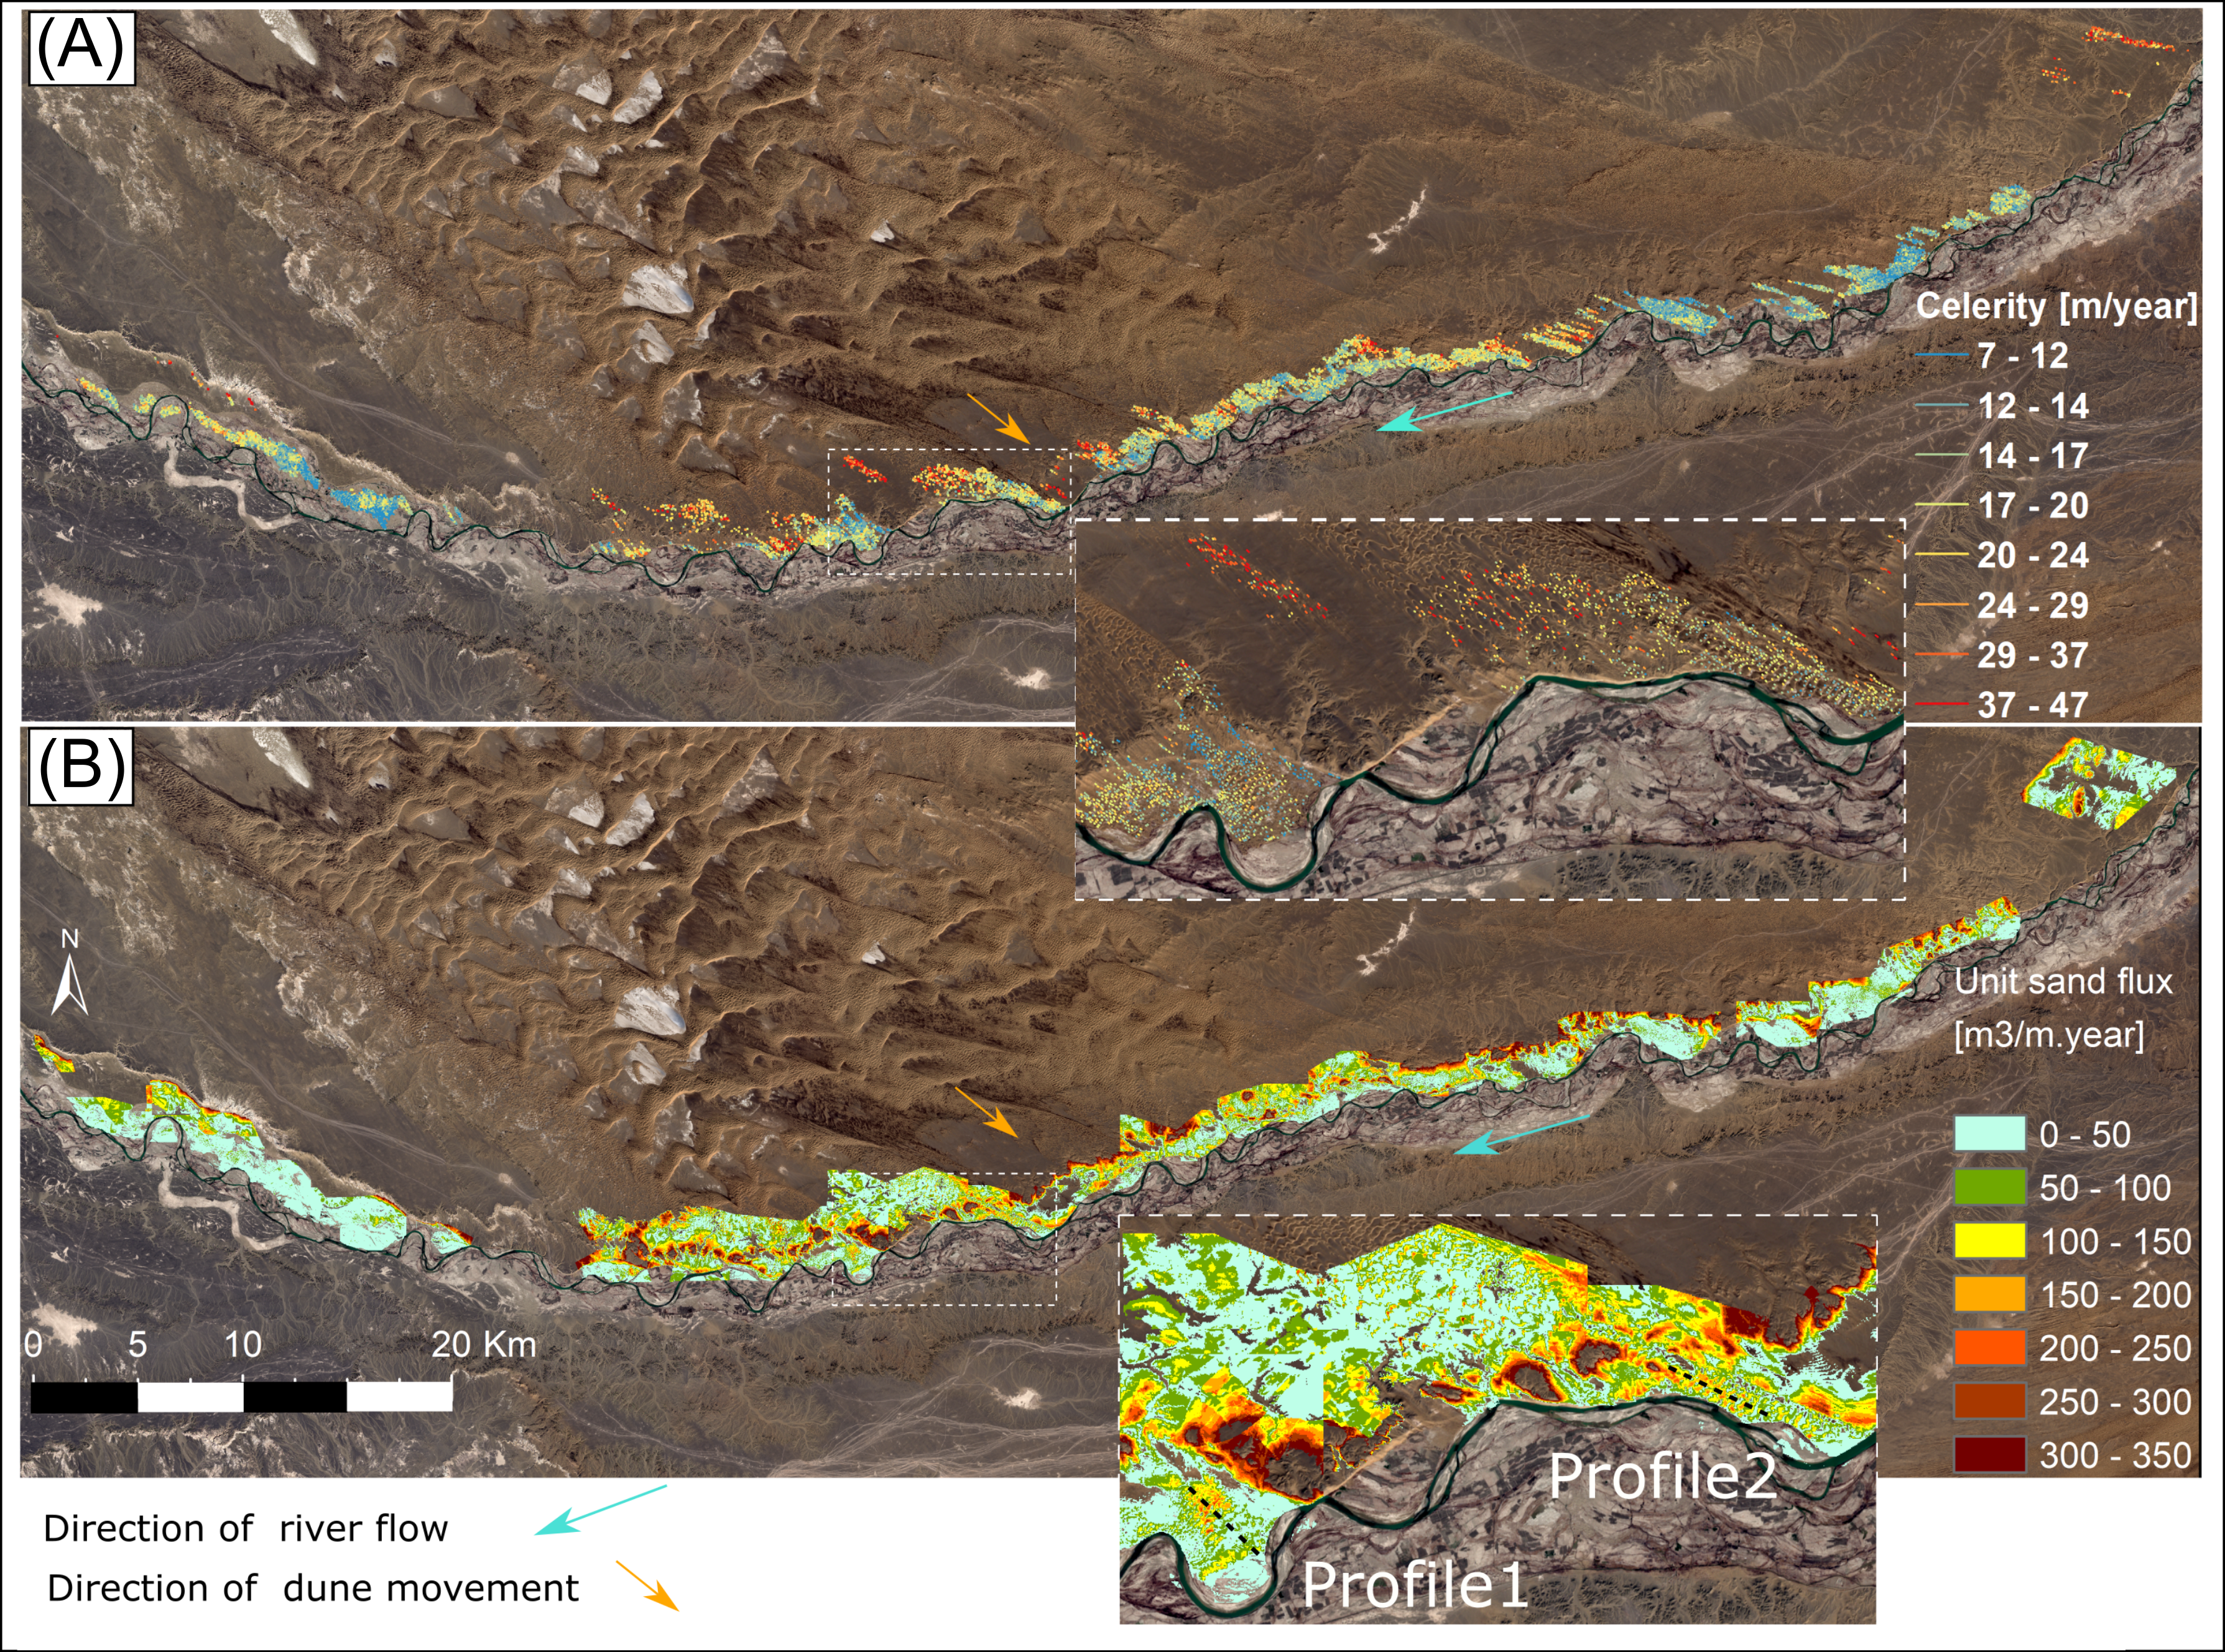
The lower Helmand riverbank and floodplains are primarily covered by compound transverse dunes with barchan dunes as the subordinate. The leftbank in the direction of the flow of the Dori and Arghanab rivers is exposed to barchan dunes in the north and north-eastern region of Registan. The unit sand flux measured perpendicular to the direction of dune migration ranges approximately 50 m3/m/year for interdune areas, and approximately 250 m3/m/year for areas covered by large dune fields (Figure 10A and B). On average, a sand dune flux of 200 m3/m/year is approximated for the lower Helmand basin but this flux estimation is strongly controlled by DSM resolution. The unit sand flux in regions with small dunes may be significantly underestimated (light blue areas in Figure 10B). The large flux contours around topographical features are falsely generated due to the inaccuracy in the generation of plain surface DEM. These are not representative of natural sand dune field flux. Sediment flux estimation for dominant dune fields is accurate enough to be used for further assessment or planning purposes. Longitudinal profiles of sand dune flux toward the Helmand River are generated for two example locations (Figure 10C). Sand flux decreases toward the Helmand River primarily because of a decrease in dune size.
Figure 10. Spatial variation of sand dune celerity in the lower Helmand basin (A) unit sand flux into the Helmand River region (B) and (C) two profiles of dune flux toward the Helmand River. Background image: Sentinel-2 natural color image compiled from imageries acquired between 16 February and 26 February 2022 (Drusch et al., 2012).
Some reports suggest that the Registan mega dune field is largely inactive (Whitney, 2006). This study shows that its northern and northeastern flank is active. Activity is limited to dune crest movement parallel to the Arghandab River and in the opposite direction to the river flow. Consequently, sand flux is not a significant contributor to the fluvial system. I estimate sand flux between 3.0 m3/m/year and 12.5 m3/m/year. This is insignificant (~5%) compared to unit sand flux values to the Helmand River in the lower Helmand basin. The dune field movement on the eastern flank of Registan is toward the Dori River, however, the Dori is a seasonal river, (i.e., flows are observed when there is rainfall in the catchment - in the spring (March-May) or monsoon (June-August)), thus, the contribution of dune sediment to fluvial system is assumed to be insignificant.
Figure 11. Sand dune celerity and sediment flux in the north and north-eastern flank of Registan (A) spatial distribution of celerity (B) detailed distribution of celerity along a section of Arghandab River and (C) its unit sand flux distribution. The longitudinal profiles or cross-section (CS) shown in this Figure is reported in Figure 8. Background image: Sentinel-2 natural color image compiled from imageries acquired between 16 February and 26 February 2022.
3.4. Validation of sand dune transport using wind energy approach
Analysis of wind energy by Fryberger (1979) and sand dune flux by Lettau & Lettau (1978) were used to validate the sand dune celerity, direction, and sand flux results presented herein. The Lower Helmand/Sistan has a mean annual wind speed of 7 m/s to 11 m/s (Figure 12A). The windrose diagrams show that the largest recorded speeds that occur in Zabol station (in Iran) are up to 37 knots. The prevailing wind direction is from the north in the upper regions of the corridor (Badghis, Herat, Shindand), north and northwest in (Zabol, Zaranj, Zahak), and west in Helmand, Kandahar, and Spin Buldak.
The sand drift potential (DP) characteristics of wind data for stations in this region are listed in Table 4. The highest DP value is calculated for Zabol (2586 UV). The lowest DP value is at Spin Buldak (101 UV). Zabol and Zahak stations in the Sistan basin have the two highest resultant DP estimates and the largest unidirectionality index (RDP/DP). The spatial distribution of DP shows that study sites 1 to 4 are located in high wind energy environments. Site 5 is located in a low-wind energy environment. The DP distribution shows that site 3 may be within the influence of the highest wind energy environment of Zabol (Figure 12B). This correlates with our estimates that the fastest sand dune migration occurs in site 3, followed by sites 2 and 1. The direction of sand dune migration shown in Figures 10A and 11A are found to be between 120° (SE) to 150° (SSE) and between 70° (ENE) to 90° (E) for lower Helmand and Arghandab valleys, respectively. This correlates with the RDD listed in Table 4 for Zabol and Kandahar/Spin Buldak.
Based on the Lettau & Lettau (1978) approach, the sand transport capacity (Q) is greatest in Zabol (503 m3/m/year) and smallest in Spin Buldak (4.7 m3/m/year). The maximum sand dune transport flux for study site 1 was estimated at around 250 m3/m/year. This also correlates well with the value of Q in Zabol because the DP value for site 1 is 301 m3/m/year. However, for site 5, the estimated sand dune flux values (maximum of 12.5 m3/m. year) are higher than those calculated (4.7 m3/m/year) using (Lettau & Lettau, 1978). One reason for this overestimation could be that sand dunes in Registan (site 5) may not be fully active, rather they may have only an active crest.
| Stations | Observation period | Drift potential (DP) (UV) | Resultant drift potential (RDP) (UV) | Unidirectionality index (RDP/DP) | Resultant drift direction (RDD) | Transport capacity Q (m3/m/year) | Wind energy environment |
|---|---|---|---|---|---|---|---|
| Site 1 | 13.5 | 15.6 | 18.7 | 5.3 | 7.2 | 6.2 | 103.1 |
| Khaf * | 2006-2013 | 890 | 730 | 0.82 | 240° | High | |
| Zohan* | 1995-2005 | 1023 | 289 | 0.3 | 112° | High | |
| Asadyeh* | 1995-2010 | 286 | 174 | 0.6 | 184° | Intermediate | |
| Nehbandan* | 1984-2020 | 484 | 409 | 0.84 | 182° | High | |
| Nosratabad* | 1995-2011 | 1200 | 942 | 0.79 | 65° | High | |
| Zabol* | 1995-2022 | 2586 | 2508 | 0.97 | 121° | 504.8 | High |
| Zahak * | 1993-2012 | 1716 | 1638 | 0.95 | 119° | High | |
| Zahedan* | 1995-2022 | 310 | 155 | 0.5 | 60° | 39.6 | Intermediate |
| Herat | 2011-2021 | 385 | 300 | 0.78 | 225° | 53.0 | Intermediate |
| Shindand | 2010-2014 | 641 | 552 | 0.86 | 185° | 71.0 | High |
| Farah | 2010-2019 | 240 | 100 | 0.42 | 116° | 9.3 | Intermediate |
| Delaram | 2011-2012 | 188 | 25 | 0.1 | 107° | 14.7 | Low |
| Helmand | 2009-2016 | 140 | 70 | 0.5 | 73° | 9.2 | Low |
| Kandahar | 2005-2020 | 185 | 37 | 0.2 | 95° | 12.1 | Low |
| Spin-Boldak | 2010-2014 | 101 | 54 | 0.5 | 80° | 4.7 | Low |
Figure 12. Spatial distribution of mean wind speed in m/s at 10 m above the ground by globalwindatlas.info in (A) and (B) Spatial distribution of drift potential in the study area. The windrose charts data is acquired from the Automated Surface Observing System (ASOS) provided by Iowa State University.
Temporal variation of wind speed for Zabol and Herat stations (Figure 13) for 2015-2022 shows that the bulk of sand dune transport occurs during the summer season (May to September), or the Sadobist Roza because the wind speed exceeds the sand transport threshold (12 knots). However, sand transport is high outside of the Sadobist Roza in the Sistan basin because the wind energy is high (DP= 2586 VU).
Figure 13. Temporal variation of wind speed in Zabol and Herat stations.
4. Discussion
4.1. Aeolian-fluvial interactions of southwest Afghanistan
Langford (1989) listed six standard aeolian-fluvial interactions that occur during fluvial flooding stages. Three of them are observed in the lower Helmand and Arghandab regions. (i) interdunes were flooded, particularly alongside intermittent channels and behind aeolian dams in eastern Registan sand sea, (ii) dunes that border flooded channels and interdunes eroded in northern Registan sand sea and lower Helmand basin and, (iii) fluvial sediment eroded by the wind and blown into the aeolian system in lower Helmand basin. The latter two are the dominant aeolian-fluvial interactions in the southwest Afghanistan and Sistan region. According to fluvial condition changes (Kirkby, 1978), the aeolian-fluvial interaction in southwest Afghanistan may be classified as fluvial dominance to balanced aeolian-fluvial.
Aeolian sediment transport into the lower Helmand basin occurs as bulk and free flux. The observed meeting angle between the dunes and rivers is larger than 90° for both Arghandab and lower Helmand valleys and the dunes are located on only one side of the river, with the river acting as a barrier to dune movement. This suggests these areas are most likely fluvially dominant, (Liu & Coulthard, 2015), however, during wet conditions, part of the aeolian sediment may be fluvially remobilized and transported to ephemeral lakes, also known as hamuns, in the Helmand delta (Figure 15). During dry conditions, this sediment is transported in the opposite direction by wind. However, fluvial flooding is dominant in both Arghandab Valley northern Registan desert, and lower Helmand Valley. These processes control the aeolian dune field expansion and contraction (Al-Masrahy & Mountney, 2015). The right bank of the Dori and Arghandab rivers and the left bank in the direction of flow of the Helmand River in the lower Helmand basin, however, are dominated by fluvial processes with minimal aeolian activity.
4.2. Sand dune celerities comparison
Sand dune celerities estimated in this study are compared with reported values from the region and other active dune sites in the world. Six studies are selected from desert areas in China: (i) Taklimakan (Dong et al., 2000), (ii) Quruq (Yang et al., 2019), (iii) Qarhan (Zhang et al., 2018b), (iv) the Kumtagh sand sea (Yang et al., 2021), (v) the Alxa Plateau (Yao et al., 2007), and (vi) the Hexi corridor (Zhang et al., 2018). Three active sand dune sites are chosen from north-eastern Iran: (i) the central Iran desert (Dasht-i- Kavir) (ii) Neyatak and (iii) Jazinak corridors in Sistan Iran. The study site from Iranian Sistan has similar wind conditions as sites 3, 4, and 5 of this study. Further observations come from the Thar desert in India, the Bodélé depression in Chad, and the Great Sand dunes in the USA.
Maximum, minimum, and average celerity values, together with reported RDP values (Figure 14), show that all studied sites are located in a high wind-energy environment (DP > 400 UV). Site 5 (Arghandab Valley) is the exception because it is a low-energy environment site (DP< 200 UV) according to Fryberger (1979). The large RDP values (1900 UV) make these sites unique. The estimated average dune celerity in the lower Helmand basin/ Afghan Sistan (sites 2 and 3) agrees well with field observation from Iranian Sistan. However, maximum sand dune celerities are much larger compared to those reported in Iranian Sistan. This may be due to the presence of many small barchan dunes. This may also be a consequence of our calculations that are based on only five months of observation data that was available. Variability in land surface roughness in the Neyatak and Jazinak corridor, which are surrounded by agricultural land, may generate larger wind resistance which could be significant. The rest of the selected sites do not match the RDP values in the lower Helmand basin. The Sanlongha, on the northern edge of China‘s Kumtagh sand sea, has RDP values that are approximately one-third lower and has approximately 64% of the average sand dune celerity of site 3. Sand dune movement in Bodélé depression in Chad is approximately 28.6% of the average sand dune celerity of site 3 and 27.5% of the RDP. The difference in sand dune celerities is predominantly due to various contributions of wind energy to sand dune transport because of different surface roughness, sand dune morphology, mineral composition, and sediment availability in these study sites.
Figure 14. Comparison of celerity values for all study sites with those reported from active sand dune sites in the region (Central Asia, Iran, and India), Bodele depression in Chad and in the Great sand dunes of USA.
4.3. Anthroprogenic impact of aeolian-fluvial interactions
Based on our estimates, and from observations made from satellite imagery, there may be a significant amount of free flux of sand into the Helmand River. Sand is deposited, from aeolian activity, into the Helmand River at 23 locations along the lower Helmand basin, with a total annual average sand flux of about 1.85 million m3 (see Table 5). This suggests that a large volume of fluvially transported sediments (suspended and bedload) may be deposited into the lower Helmand Valley. Further, during wet seasons or a flood, a significant volume of sediment may become mobilized deposit into the Helmand River, into upstream floodplains of the lower Helmand basin, and the Gowde-Zireh, a natural ephemeral lake in the south of Nimurz province.
The Kamal Khan dam on the Helmand River was built for flood protection, flow downstream regulation, and to provide water for irrigation canals (Figure 15). Since construction, the Kamal Khan dam has negatively impacted the region's natural aeolian-fluvial sediment interaction (Figure 15). Following the dam construction, a significant part of the total fluvial flux, both the remobilized aeolian sediments during flood conditions and general fluvial sediment supply from upstream, becomes trapped in the Kamal Khan dam (Figure 15). If all remobilized sand dune sediments are deposited in the Kamal Khan reservoir, this may result in a 3.6% annual storage loss as a result of aeolian sediment accumulation in the reservoir. This accelerated sedimentation can significantly restrict its operational flexibility and may negatively impact the function of the Kamal Khan Dam.
Figure 15. Fluvial and aeolian sediment transport routes in Arghandab and lower Helmand valley before and after the Kamal Khan Dam operation. Image: Landsat 4-5 true color image from 04.06.1993 courtesy of the U.S. Geological Survey.
More importantly, the continuous influx of both aeolian and fluvial sediments in the upstream of Kamal Khan dam may gradually lead to riverbed aggradation. The aggradation and accumulation of sediment can significantly impact agriculture in the lower Helmand basin. The aggradation of the riverbed can change the river cross-section geometry from the current narrow and incised channels to wider and shallower channels. This will reduce the elevation difference between the riverbed and the floodplain. This may increase the exposure of fertile floodplains, and agricultural land, to more frequent flooding. This means, that agricultural land in lower Helmand Valley may be flooded even during small flow events. Conversely, during the dry period, a greater surface area of exposed and reworked sediment may be easily remobilized by wind over the agricultural area. The increased aeolian mobilization on the dry riverbed may change the current fluvial dominant condition. The increase in aeolian activity during these seasons may negatively impact the fertile floodplains and agricultural land.
The livelihood of people who live in the region may be adversely impacted by the change in the aeolian-fluvial interaction of the Lower Helmand basin because agriculture is their only source of income. Mitigation and sediment stabilization factors, such as active riverbed geometry monitoring and long-term planning for dune stabilization in lower Helmand Valley are necessary for sustainable agricultural activity and Kamal Khan dam operation. A combination of mulching and plantation of mostly Haloxylon species have been extensively practiced in Iranian Sistan for dune stabilization (e.g., Zoraghi et al., 2021; Amiraslani & Dragovich, 2011) that can also be experimented in lower Helmand. This information is important for sediment stabilization and mitigation planning measures to reduce sand dune influx, river aggradation, and reservoir sedimentation in lower Helmand.
| Latitude [ °] | Longitude [ °] | Length [m] | Unit sand dune flux [m3/m. year] | Sand dune flux [m3/year]x1000 |
|---|---|---|---|---|
| 30.312 | 63.153 | 860 | 64 | 55.04 |
| 30.362 | 63.231 | 360 | 64 | 23.04 |
| 30.301 | 63.122 | 410 | 75 | 30.75 |
| 30.279 | 63.087 | 1468 | 115 | 168.82 |
| 30.265 | 62.955 | 738 | 35 | 25.83 |
| 30.259 | 62.943 | 990 | 15 | 14.85 |
| 30.247 | 62.930 | 610 | 60 | 36.60 |
| 30.241 | 62.904 | 460 | 80 | 36.80 |
| 30.244 | 62.887 | 520 | 70 | 36.40 |
| 30.241 | 62.848 | 520 | 50 | 26.00 |
| 30.228 | 62.803 | 900 | 60 | 54.00 |
| 30.216 | 62.756 | 840 | 164 | 137.76 |
| 30.212 | 62.749 | 750 | 90 | 67.50 |
| 30.203 | 62.717 | 2050 | 64 | 131.20 |
| 30.178 | 62.672 | 670 | 120 | 80.40 |
| 30.183 | 62.632 | 2980 | 120 | 357.60 |
| 30.166 | 62.584 | 870 | 55 | 47.85 |
| 30.165 | 62.564 | 1040 | 70 | 72.80 |
| 30.158 | 62.537 | 780 | 150 | 117.00 |
| 30.161 | 62.503 | 1370 | 85 | 116.45 |
| 30.159 | 62.445 | 700 | 30 | 21.00 |
| 30.205 | 62.266 | 990 | 85 | 84.15 |
| 30.225 | 62.226 | 1560 | 70 | 109.20 |
4.4. Active sand dunes at the northeastern flank of Registan
To date, a comprehensive field study of sand dune migration for this region does not exist. The study presented herein identified sand dune movement in the northern and northeastern flanks of the Registan desert where dune migration was previously reported as inactive, apart from a section along the western edges (Whitney, 2006). The study finds that the sand dune migrates in the opposite direction of the Arghandab and Dori rivers. The aeolian sediment (red color) discharges onto the riverbed (white color) and floodplains at several locations along their interface where they are transported downstream during flood events. This finding is in line with river system depositional regimes despite the Arghandab dam trapping fluvial sediments from the catchment area. Because the fluvial sediment deficit is partly compensated by aeolian sediment input from the northeastern edges of Registan, this prevents the river from becoming predominantly erosional, which can have negative impacts on ecology and groundwater levels in the floodplains of Arghandab and Dori rivers.
5. Conclusions
Remote sensing data was used to estimate dune-field celerity. The estimated sand dune flux in identified sand dune fields in southwest Afghanistan transports considerable volumes of sediment into the Helmand River in the lower Helmand basin. Lower volumes of sediment are deposited into the Arghandab and Dori rivers in the north and the northeastern flanks of the Registan desert.
The automatic dune movement detection method used in this study works well for dunes that preserve their shapes with time. However, dunes with significant evolution as a result of collision or sand detachment (free flux) required manual improvement.
Sand dune migration rates up to 191 m/year celerity are estimated for small barchan dunes at the beginning of sand dune fields in Afghanistan’s Sistan, south of Zaranj city. The region may have one of the world’s fastest dune migration rates with the highest sand drift potential of inland deserts (Zabol with a DP of 2586 UV). I estimate that up to 250 m3/m/year of sediment may enter the Helmand River in the lower Helmand basin. Sand dune celerity decreases closer to the Helmand River, as the sand dunes join the mega sand dune fields in Dashti-Margo on the east bank of the Helmand River. However, unit sand dune flux into the regions proximal to the Arghandab and Dori rivers is found to be insignificant because the dune migration direction is quasi-parallel to the river flow direction and dunes interact with the fluvial system in only a few locations. The study also identified sand dune movement in the northern and the northeastern flank of the Registan desert where dune migration was previously reported as inactive.
Finally, a large volume of sand influx into the Helmand River may have significant implications for the management of the recently built Kamal Khan Dam and the agricultural sector in the river region. Identification of the regions with high sediment delivery to Helmand River is the first step to defining potential protection measures to reduce the sand influx and support the sustainable operation of the Kamal Khan reservoir and associated agriculture in the lower Helmand Valley.
Acknowledgments
Thanks to Planet Inc. for providing the PlanetScope Visual Ortho Scene satellite imageries for this study. The author thanks the U.S. Geological Survey for providing the archived Landsat imageries and European Union, Copern. s and Sentinel hub for the providing Sentinel-2 imageries. Special thanks to Executive Editor Peter Burgess and reviewer Brian Burnham for their comprehensive reviews and helpful comments that significantly improved the manuscript. Last but not least thanks to the Ministry of Public Works of Afghanistan, Rahimuddin Tayed and Mohammad Shafiq Wakil for providing the images from the study area.
Authors contribution
The author independently analyzed, interpreted the data, wrote the manuscript, and prepared the figures.
Data availability statement
The author confirms that the data supporting all the interpretations are available within the article.
Conflict of interest
The author declares that they have no known competing financial interests or personal relationships that could have appeared to influence the work reported in this paper.
References
Abbasi, H., Opp, C., Groll, M., & Gohardoust, A. (2019). Wind regime and sand transport in the Sistan and Registan regions (Iran/Afghanistan). Zeitschrift Für Geomorphologie, Supplementary Issues, 62(1), 41–57. https://doi.org/10.1127/zfg_suppl/2019/0543 DOI: https://doi.org/10.1127/zfg_suppl/2019/0543
Abbasi, H., Opp, C., Groll, M., Rohipour, H., Khosroshahi, M., Khaksarian, F., & Gohardoust, A. (2018). Spatial and temporal variation of the aeolian sediment transport in the ephemeral Baringak Lake (Sistan Plain, Iran) using field measurements and geostatistical analyses. Zeitschrift Für Geomorphologie, 61(4), 315–326. https://doi.org/10.1127/zfg/2018/0451 DOI: https://doi.org/10.1127/zfg/2018/0451
Abbasi, M., Feiznia, S., Ahmadi, H., & Kazmei, Y. (2010). Study of sand dunes origin by geochemical trades of eolian sediment in Niatak. Journal of Arid Biome, 1(1), 34–44. https://aridbiom.yazd.ac.ir/article_34_63610b3cb11c354acde765798a055f5e.pdf
Al-Masrahy, M. A., & Mountney, N. P. (2015). A classification scheme for fluvial–aeolian system interaction in desert-margin settings. Aeolian Research, 17, 67–88. https://doi.org/10.1016/j.aeolia.2015.01.010 DOI: https://doi.org/10.1016/j.aeolia.2015.01.010
Amiraslani, F., & Dragovich, D. (2011). Combating desertification in Iran over the last 50 years: An overview of changing approaches. Journal of Environmental Management, 92(1), 1–13. https://doi.org/10.1016/j.jenvman.2010.08.012 DOI: https://doi.org/10.1016/j.jenvman.2010.08.012
Delgado Blasco, J. M., Chini, M., Verstraeten, G., & Hanssen, R. F. (2020). Sand Dune Dynamics Exploiting a Fully Automatic Method Using Satellite SAR Data. Remote Sensing, 12(23), 3993. https://doi.org/10.3390/rs12233993 DOI: https://doi.org/10.3390/rs12233993
Dong, Z., Wang, X., & Chen, G. (2000). Monitoring sand dune advance in the Taklimakan Desert. Geomorphology, 35(3-4), 219–231. https://doi.org/10.1016/S0169-555X(00)00039-8 DOI: https://doi.org/10.1016/S0169-555X(00)00039-8
Drusch, M., Del Bello, U., Carlier, S., Colin, O., Fernandez, V., Gascon, F., Hoersch, B., Isola, C., Laberinti, P., Martimort, P., Meygret, A., Spoto, F., Sy, O., Marchese, F., & Bargellini, P. (2012). Sentinel-2: ESA’s Optical High-Resolution Mission for GMES Operational Services. Remote Sensing of Environment, 120, 25–36. https://doi.org/10.1016/j.rse.2011.11.026 DOI: https://doi.org/10.1016/j.rse.2011.11.026
Elbelrhiti, H., Andreotti, B., & Claudin, P. (2008). Barchan dune corridors: Field characterization and investigation of control parameters. Journal of Geophysical Research, 113(F2). https://doi.org/10.1029/2007JF000767 DOI: https://doi.org/10.1029/2007JF000767
Favre, R., & Kamal, G. M. (2004). Watershed Atlas of Afghanistan: First edition- Working document for planners. http://aizon.org/Watershed%20Atlas%20of%20Afghansitan/Volume%20I/Watershed%20Atlas_Part%20I%20&%20II.pdf
Fryberger, S. (1979). Dune forms and wind regime: In: McKee, E. D. (ed.): A study of global sand seas. – Professional Paper 1052: 137–169, United State Geological Survey, US Government. Advance online publication. https://doi.org/10.3133/pp1052 DOI: https://doi.org/10.3133/pp1052
Gadal, C., Narteau, C., Ewing, R. C., Gunn, A., Jerolmack, D., Andreotti, B., & Claudin, P. (2020). Spatial and Temporal Development of Incipient Dunes. Geophysical Research Letters, 47(16), Article e2020GL088919. https://doi.org/10.1029/2020GL088919 DOI: https://doi.org/10.1029/2020GL088919
Ghadiry, M., Shalaby, A., & Koch, B. (2012). A new GIS-based model for automated extraction of Sand Dune encroachment case study: Dakhla Oases, western desert of Egypt. The Egyptian Journal of Remote Sensing and Space Science, 15(1), 53–65. https://doi.org/10.1016/j.ejrs.2012.04.001 DOI: https://doi.org/10.1016/j.ejrs.2012.04.001
Hamzeh, M. A., Mahmudy Gharaie, M. H., Alizadeh Lahijani, H., Moussavi Harami, R., & Jamali, M. (2017). Aeolian sediments deposited in Lake Hamoun; the proxy of frequency and severity of dust storms in Sistan since the late glacial. Journal of Stratigraphy and Sedimentology Researches, 33(1), 1–24. https://doi.org/10.22108/jssr.2017.21285
Heydari Nasab, M., Karam, A., Negaresh, H., & Pahlavanravi, A. (2018). Hazards Analysis of Displacement of Sand Dunes in Sistan Plain. Journal of Arid Regions Geographics Studies, 9(34), 59–75. http://journals.hsu.ac.ir/jarhs/files/site1/user_files_4dfa14/m3670199047-A-10-1527-1-6c5e7ec.pdf
Huntington, E. (1905). The basin of eastern Persia and Sistan in “the Explorations in Turkestan, with an account of The basin of eastern Persia and Sistan. Expedition of 1903”. Carnegie Institution of Washington. https://doi.org/10.5962/t.174871 DOI: https://doi.org/10.5962/t.174871
Iowa environment mesonet. (2022). IEM :: Download ASOS/AWOS/METAR Data. Iowa State University. https://mesonet.agron.iastate.edu/request/download.phtml?network=AF__ASOS
Kirkby, M. J. (1978). The Stream Head as A Significant Geomorphic Threshold. https://api.taylorfrancis.com/content/chapters/edit/download?identifierName=doi&identifierValue=10.4324/9781003028697-4&type=chapterpdf
Lancaster, N. (2009). Aeolian features and processes. In R. Young & L. Norby (Eds.), Geological monitoring. Geological Soc. of America. https://doi.org/10.1130/2009.monitoring(01) DOI: https://doi.org/10.1130/2009.monitoring(01)
Langford, R. P. (1989). Fluvial-aeolian interactions: Part I, modern systems. Sedimentology, 36(6), 1023–1035. https://doi.org/10.1111/j.1365-3091.1989.tb01540.x DOI: https://doi.org/10.1111/j.1365-3091.1989.tb01540.x
Lettau, K., & Lettau, H. (1978). Experimental and micrometeorological field studies of dune migration: H. Lettau (Eds.), Exploring the World’s Driest Climate, Center for Climatic Research, University of Wisconsin-Madison (1978), pp. 110-147 IES Report 101.
McMahon, H. (1906). Recent Survey and Exploration in Seistan. The Geographical Journal, 28(3), 209. https://doi.org/10.2307/1776729 DOI: https://doi.org/10.2307/1776729
Negaresh, H., & Latifi, L. (2008). Geomorphological Analysis of Dunes Drifting Process in the East of Sistan Plain During Recent Draughts. Geography and Development, 6(12), 43–60. https://doi.org/10.22111/gdij.2008.1242
Planet Labs Inc (2022). Plant imagery product specification. https://assets.planet.com/docs/Planet_Combined_Imagery_Product_Specs_letter_screen.pdf
Pajhwok Afghan News. (2011). 20 houses buried in Nimroz sandstorm [Press release]. https://pajhwok.com/2011/06/25/20-houses-buried-nimroz-sandstorm/
Rashki, A. (2012). Seasonality and mineral, chemical and optical properties of dust storms in the Sistan region of Iran, and their influence on human health [, University of Pretoria]. repository.up.ac.za. https://repository.up.ac.za/bitstream/2263/27734/10/Complete.pdf
Shao, Y., Wyrwoll, K.‑H., Chappell, A., Huang, J., Lin, Z., McTainsh, G. H., Mikami, M., Tanaka, T. Y., Wang, X., & Yoon, S. (2011). Dust cycle: An emerging core theme in Earth system science. Aeolian Research, 2(4), 181–204. https://doi.org/10.1016/j.aeolia.2011.02.001 DOI: https://doi.org/10.1016/j.aeolia.2011.02.001
Tate, G. P. (1909). The frontiers of Baluchistan; travels on the borders of Persia and Afghanistan,. https://www.loc.gov/item/09022569/
United Nations Assistance Mission in Afghanistan. (2003). Afghanistan: Sandstorms affect over ten thousand people - Afghanistan [Press release]. https://reliefweb.int/report/afghanistan/afghanistan-sandstorms-affect-over-ten-thousand-people
Vagara, G. (2012). Spatio-temporal distribution of dust storms – a global coverage using NASA TOMS areosol measurements. Hungarian Geographical Bulletin, 61(4), 275–298. http://www.mtafki.hu/konyvtar/kiadv/HunGeoBull2012/HunGeoBull_2012_4_275-298.pdf
Whitney, J. W. (2006). Geology, water, and wind in the lower Helmand Basin, southern Afghanistan: U.S. Geological Survey Scientific Investigations Report 2006–5182. DOI: https://doi.org/10.3133/sir20065182
Yang, H., Cao, J., & Hou, X. (2019). Characteristics of Aeolian Dune, Wind Regime and Sand Transport in Hobq Desert, China. Applied Sciences, 9(24), 5543. https://doi.org/10.3390/app9245543 DOI: https://doi.org/10.3390/app9245543
Yang, Z., Qian, G., Dong, Z., Tian, M., & Lu, J. (2021). Migration of barchan dunes and factors that influence migration in the Sanlongsha dune field of the northern Kumtagh Sand Sea, China. Geomorphology, 378, 107615. https://doi.org/10.1016/j.geomorph.2021.107615 DOI: https://doi.org/10.1016/j.geomorph.2021.107615
Yao, Z. Y., Wang, T., Han, Z. W., Zhang, W. M., & Zhao, A. G. (2007). Migration of sand dunes on the northern Alxa Plateau, Inner Mongolia, China. Journal of Arid Environments, 70(1), 80–93. https://doi.org/10.1016/j.jaridenv.2006.12.012 DOI: https://doi.org/10.1016/j.jaridenv.2006.12.012
Zhang, Z., Dong, Z., Hu, G., & Parteli, E. (2018). Migration and Morphology of Asymmetric Barchans in the Central Hexi Corridor of Northwest China. Geosciences, 8(6), 204. https://doi.org/10.3390/geosciences8060204 DOI: https://doi.org/10.3390/geosciences8060204
Zhang, Z., Dong, Z., Qian, G., Li, J., & Luo, W. (2018b). Formation and development of dunes in the northern Qarhan Desert, central Qaidam Basin, China. Geological Journal, 53(3), 1123–1134. https://doi.org/10.1002/gj.2947 DOI: https://doi.org/10.1002/gj.2947
Zoraghi, G. H., Shabani Goraji, K., Noura, M. R., Rashki, A. R., & Bumby, A. (2019). Identification of sand dune sources in the east Sistan, Iran by using mineralogical and morphoscopic characterization of sediments. Iranian Journal of Earth Sciences, 11(3), 183–195. https://doi.org/10.30495/ijes.2019.667378
Zoraghi, G., Goraji, K. S., Noura, M., Rashki, A., & Bumby, A. (2021). An assessment of the ability of a novel mulch to stabilise sand dunes in the Sistan region of Iran. International Journal of Environmental Studies, 78(5), 759–772. https://doi.org/10.1080/00207233.2020.1864189 DOI: https://doi.org/10.1080/00207233.2020.1864189
Downloads
How to Cite
License
Some rights reserved 2023 Najibullah Sadid

This work is licensed under a Creative Commons Attribution 4.0 International License.