
New approaches to the architectural analysis of deltaic outcrops: Implications for subsurface reservoir characterization and paleoenvironmental reconstruction
DOI:
https://doi.org/10.57035/journals/sdk.2023.e11.1051Keywords:
Delta lobes, Reservoir Characterization, Virtual outcrop models, Shallow marine sedimentology, Outcrop metricsAbstract
This study defines a new workflow to investigate the internal facies architecture of a river-dominated delta deposit using outcrops of the Cretaceous Panther Tongue of the Star Point Sandstone in central Utah, U.S.A. Photorealistic virtual outcrop models (VOM) were created from ~13 linear-km of outcrop. The VOMs, alongside field observations, were used to identify and map facies and facies associations over the ~25 m-thick stratigraphic interval. In order to investigate this system as a potential subsurface reservoir analog, a database of measurements was constructed using 60 digital sections that were measured within the VOMs at 152 m (~500 ft) spacing. This database characterizes a total of 508 sandstone beds by their thickness, length, and dip, from which the average thickness (0.78 m), bed length (330 m), and bed dip (2˚ towards the south) were calculated. Thinning rates were also calculated in both depositional strike and depositional dip directions (1.37x10⁻² and 1.01x10⁻² respectively). These comparable values suggest that the sandstone beds thin equally laterally and longitudinally from the sediment source, a characteristic typical of modern-day river-dominated deltas. The dataset also includes siltstone unit thickness data, recording an average thickness of 0.81 m, and a trend of increasing siltstone abundance and thickness moving from proximal areas where siltstones comprise 3% of the succession, and 77% in the most distal areas. The impact of observational scale was also investigated by querying the database at multiple physical length scales to include more typical well spacings of 305 and 610 m (500 and 1000 ft). This additional analysis emphasizes the role of variability in lithologically heterogeneous systems and underscores the utility of outcrop analogs to better understand sources of uncertainty. From these data, a series of depositional environment maps was constructed, illustrating the evolution of eight delta lobes that encompass the preserved depositional history of the study area. These maps document the compensational stacking of individual lobes and the progressive southward directed trajectory of the Panther Tongue delta system. Results of this analysis provide insight into depositional processes and scales of heterogeneity of the Panther Tongue and, by extension, analogous river-dominated delta systems. The workflow established in this study is exportable to other sedimentary outcrops and environments, thus demonstrating that VOMs can be used as a basis for quantitative database development and reservoir modeling inputs.
Downloads
Lay summary
The authors present a study examining the Panther Tongue, an ancient delta system that fed into the western shores of the Western Interior Seaway (USA). This study uses 13 km of virtual outcrops models, constructed via drone photography, to map out the architecture of hundreds of layers (beds) within the deposit. The database docu-ments their thickness, sedimentary structures, grain size, and bed length to better understand how these beds relate to each other and how they can be used to help us reconstruct the depositional history and reservoir characteristics of these and similar stratigraphic deposits.
1. Introduction
Reservoir studies of outcropping sedimentary analogs commonly use technologies such as lidar and/or structure-from-motion (SfM) stereophotogrammetry to reconstruct true-scale, photorealistic virtual outcrop models (VOMs) (e.g., Buckley et al., 2019; 2022). VOMs offer several major advantages over traditional photo panels and correlation panels for documenting the stratigraphic architecture of outcrops, such as the ability to efficiently acquire large-scale, high-resolution imagery with spatial accuracy that permits direct measurement of size, shape, and orientation of key features (Howell & Burnham, 2021; Howell et al., 2021). Additionally, an ever-increasing catalogue of such datasets is now publicly available (e.g., www.v3geo.com) for interrogation, creating many possibilities for future studies. VOMs are queried in different ways depending on the purpose of the study, however, they are underutilized in the construction of quantitative databases through systematic data collection from large-scale virtual outcrops (Howell et al., 2008a; Biber et al., 2018; Thomas et al., 2021). Most importantly, effective reservoir analog studies require a consistent workflow for data collection at a variety of scales in a way that is useful and efficient for reservoir characterization and prediction (Marques et al., 2020; Usman et al., 2021).
The Campanian Panther Tongue of the Star Point Sandstone is a river-dominated delta complex that prograded on the western shore of the Cretaceous Western Interior Seaway (Newman & Chan, 1991). It has long been the focus of many sedimentological, stratigraphic, and architectural studies (Young, 1955; Howard, 1966; Frey & Howard, 1985; Posamentier & Morris, 2000; Hwang & Heller 2002; Olariu et al., 2005, 2010; Enge et al., 2010b; Forzoni et al., 2015) due in part to its extensive outcrops, which make it useful in studies of sequence stratigraphy and as a worldwide analog for subsurface deltaic reservoirs (Aune, 2006; Howell et al., 2008a; 2008b; Enge & Howell, 2010). Although these outcrops are relatively well known in the North American sedimentary geology community (e.g., Bhattacharya et al. 2007), an analysis of the mesoscale internal architecture over the full extent of exposures is not yet available.
This study outlines a holistic, systematic, and detailed approach to document the internal architecture, lithological heterogeneity, and sedimentological character of the Panther Tongue delta system, using a method that could be easily applied to other ancient depositional systems. Whereas VOMs are now widely used for outcrop characterization, our approach incorporates a grid of regularly-spaced pseudowells derived from the VOMs, and demonstrates how these can be used to build a quantitative database of key metrics that are important for reservoir characterization. The aims of this study are threefold: 1) to develop this new approach in order to document and analyze the internal architecture of sedimentary outcrops; 2) to use this workflow to create a database that records the detailed geometry of these deltaic deposits with the aim of constraining the lateral connectivity and heterogeneity; and 3) to synthesize the data in order to document the spatial and temporal changes within the Panther Tongue, so that these insights can inform depositional analyses on similar sedimentary systems.
2. Geological Setting and Stratigraphy
The Panther Tongue is the basal informal unit of the Campanian Star Point Sandstone, a sandstone-rich unit that forms the first of a series of regressive, shallow-marine bodies extending eastward into the offshore deposits of the Western Interior Seaway (i.e., Mancos Shale at this location) (Fig. 1) (Spieker & Reeside, 1925; Young, 1955; Howard, 1966). It forms the lowest cliff-forming sand-prone unit in the Wasatch Plateau and the northern Book Cliffs. Exposures of the Starpoint Sandstone extend almost 100 km southwards along the Wasatch Plateau, and surround the town of Helper, Utah, where the unit thins, fines and interfingers with Mancos Shale <20 km to the east (Fig. 2; Hampson et al., 2011; Forzoni et al., 2015). The transition from the recessively-weathering, grey mudstone of the offshore Mancos Shale (Spieker & Reeside, 1925; Armstrong, 1968) to the relatively sand-prone, cliff-forming unit that constitutes the Panther Tongue represents the earliest progradation of deltaic sediments of the Mesaverde Group at this location (Howard, 1966; Newman & Chan, 1991). The top surface of the Panther Tongue is sharp and characterized by a medium-grained sandstone that is heavily bioturbated (Hwang & Heller, 2002; Enge et al., 2010b). It is interpreted as a transgressive erosion or ravinement surface, possibly driven by a rapid sea-level rise (cf. Howell et al., 2018), which truncates the uppermost Panther Tongue, removing its proximal delta plain deposits (Hwang & Heller, 2002). The Panther Tongue is overlain by offshore deposits of the Mancos Shale, followed by prograding shoreface deposits of the Storrs and Spring Canyon Tongues of the Star Point Sandstone (Howell & Flint 2004) and ultimately, the coal-bearing Blackhawk Formation (Spieker & Reeside, 1925; Clark, 1928; Young, 1955; O’Byrne & Flint, 1995; Kamola & Van Wagoner, 1995) (Fig. 1). Sediments delivered to the Campanian shorelines and deltas of Utah, such as the Panther Tongue, were primarily derived from the Sevier Highlands to the west (Robinson & Slingerland, 1998; DeCelles & Coogan, 2006; Bartschi et al., 2018), although there is also regional evidence of sediment input via longshore drift from the north (Fielding, 2010), and via axial drainage systems coming from the south (Lawton & Bradford 2011; St. Pierre & Johnson, 2022).
Figure 1. Geologic overview of the Panther Tongue. (A) Late Cretaceous paleogeographic configuration of North America showing the Western Interior Seaway shoreline (modified from Robinson Roberts and Kirschbaum, 1995), paleolatitudes are averages from ~90 m.y. to 60 m.y. (Irving, 1979). The red outline highlights the state of Utah and the star denotes the study area. (B) Stratigraphy of the Mesaverde Group in east-central Utah showing the Wasatch Plateau and Book Cliffs stratigraphy (modified from Hampson et al., 2011). The Panther Tongue is highlighted in bright yellow and outlined in blue.
The Panther Tongue is approximately 25 m thick with upwardly-increasing bed thickness and grain size profiles. Overall, the sediment grain size distribution within the Panther Tongue is relatively narrow, exhibiting a vertical shift from a silt-prone base that coarsens upwards to predominantly very fine- to fine-grained sandstones with rare, medium-grained sandstones locally towards the top of the succession (Newman & Chan, 1991; Enge & Howell, 2010; Olariu et al., 2010; Enge et al., 2010b). Previous work demonstrated that the Panther Tongue is characterized by clinoforms that dip gently at 0.4-2.65˚ (with a mean of 1.25˚) to the south (Enge et al., 2010a; 2010b; Olariu et al., 2010). An overall north-to-south paleocurrent direction (Newman & Chan, 1991; Olariu et al., 2005; 2010; Enge et al., 2010a; 2010b) resulted in a paleo-shoreline (shown in Fig. 2) with a complex morphology (Hampson et al., 2011; Forzoni et al., 2015). This contrasts with the regional north-to-south paleo-shoreline of the Western Interior Seaway and the eastward progradation of the overlying shoreface deposits of the Storrs Tongue and the Blackhawk Formation (O’Byrne & Flint, 1995; Kamola & Van Wagoner, 1995; Howell & Flint 2004).
The Panther Tongue is interpreted as a river-dominated delta system (Howard, 1966; Newman & Chan, 1991; Hwang & Heller, 2002; Hampson et al., 2011) containing typical prodelta facies at the base of the succession, with superposed distal delta front, proximal delta front, and terminal distributary channel deposits of the delta plain (Bhattacharya, 2006; Howell et al., 2008b). Recent studies of the Panther Tongue documented the heterogeneity (e.g., facies relationships and geometry) of specific architectural components such as the delta front clinoforms and how these dipping features could impact reservoir performance (Howell et al., 2008a; Enge et al., 2010a; 2010b; Enge & Howell, 2010; Olariu et al., 2010). Additionally, deposits interpreted to be a terminal distributary channel in the western portion of the study area at Sowbelly Gulch were documented in detail by Olariu et al., (2005; 2010) and Olariu & Bhattacharya (2006).
Figure 2. (A) A paleogeographic map showing field location during the Late Cretaceous relative to the Western Interior Seaway (modified from Hampson et al., 2011). (B) A map showing the location of the study area in the state of Utah. (C) A map showing the Mesaverde Group and the Mancos Shale outcrop belt in east-central Utah, highlighting the study area near Helper, UT (modified from Hampson et al., 2011; Forzoni et al., 2015; and informed by https://geology.utah.gov/apps/ intgeomap/. (D) A map showing the locations of hand samples, digitally measured sections, outcrop measured sections (including previously published examples and from this study), and photogrammetry imagery coverage. Base map from Google Maps.
This study focuses on outcrops of the proximal Panther Tongue around the town of Helper, Utah (Fig. 2). The field site covers an area of 22 km2 and spans ~13 linear km of outcrop exposures with variable orientations. The study area is transected by US Route 6 (Highway 6), which subdivides the outcrop exposures into western and eastern sections that are separated by a 350 to 1200 m gap (Fig. 2). The various orientations (strike, dip, and orthogonal) and considerable continuity of these outcrop exposures enable the investigation of the architectural components and connectivity of this ancient delta deposit with a high degree of fidelity.
3. Methods and Dataset
3.1. Field data collection
Field data collection included measuring three complete stratigraphic sections and collecting 19 hand samples that were thin sectioned for petrographic grain size analysis (yellow stars on Fig. 2D). The measured sections were described at a cm-scale using standard methods, and combined with previously published sections (from Enge et al., 2010a; 2010b; Olariu et al., 2010). They span more than 260 m of total stratigraphic thickness, with individual sections ranging from 7.6 m to 26.1 m. The measured sections and grain size data were used to identify seven lithofacies which were then grouped into four facies associations representing depositional sub-environments (e.g., distributary channel, proximal delta front, distal delta front, prodelta) following the work of Olariu et al. (2010). The facies associations derived from outcrop observations were used to calibrate sections of the VOMs in which they were documented and then extrapolated outward into parts of the model without associated measured sections.
An extensive UAV imagery dataset that includes more than 8,000 high-resolution images, capturing both dip- and strike-oriented outcrops of the Panther Tongue, was collected using a DJI Phantom 4 Professional drone. The images were processed into eight three-dimensional photogrammetry models using Agisoft Metashape, which were interpreted in LIME (Enge et al., 2007; Buckley et al., 2019; 2022; Chmielewska et al., 2020; Howell et al., 2021). Please note that the VOMs are publicly available via data release (Atlas et al., 2020a; 2020b). These VOMs were then calibrated using the outcrop measured sections collected during this study along with an additional nine measured sections from Enge et al. (2010a; 2010b) and Olariu et al. (2010) that have been included as tie points to calibrate the VOMs (Fig. 2). This calibration step is necessary to confirm that the observed spatial relationships, lithology, and sedimentary structures are consistent. Observations, measurements, and calculations (e.g., sedimentary, lithological, dimensional) were then systematically collected from the calibrated VOM and compiled into a database that records the detailed internal architecture of the Panther Tongue delta system.
3.2. Database data collection
To create a robust database that represents the internal architecture of this delta system, 60 digitally measured sections were constructed at a consistent spacing of 152 meters. This spacing was chosen because it is tighter than the typical well spacing in a conventional hydrocarbon field (e.g., 10 acres spacing at 201 m; Pranter et al. (2008)) and is in alignment with the spacing of the Intensive Resource Development strategy proposed for other Mesaverde Group outcrops sensu Kuuskraa & Ammer (2004). The outcrop exposure is discontinuous through the area (Fig. 2), as are the resulting VOMs. However, the 152 m spacing was continuous through each of the eight individual three-dimensional photogrammetry models. The digitally measured sections record bed thickness, bed lithology, simplified grain size, sedimentary structures, and bed dip. Each section is paired with two additional digitally measured sections that are spaced 5 m to the left and right of the original one. The use of two scales of spacing between digitally measured sections permits the assessment of lateral and vertical variations over small-scale (<10 m) and large-scale (>10 m) intervals, thus capturing the heterogeneity of individual bed character (Fig. 3). During this data collection, each sandstone bed was assigned an identification number (1-508; supplemental dataset; Atlas et al., 2020a) to enable correlation to adjacent digitally measured sections, recording lateral changes on a large scale (100-1000s m) and total bed lengths; permitting the quantification of the geometry and characteristics of 508 beds from 1513 bed measurements. This also includes 601 siltstone unit thickness measurements (which includes silt and clay grain sizes). Constructing such a detailed database highlighted a significant benefit of VOMs that has so far been underutilized.
The VOM metric database (see supplementary data file; Atlas et al., 2020a) contains observations and measurements of 508 sandstone beds, totaling 910 bed measurements as individual beds were measured more than once throughout the VOMs, depending on their runout lengths and the number of times they were intersected by the digitally measured sections. From this dataset, bed runout lengths have been measured for 486 of the 508 sandstone beds and 1,056 sandstone bed thinning rates were calculated ovelr small-scale (<10 m) and large-scale (>10 m) distances. Bed runout lengths refer to the lengths of individual sandstone beds that can be mapped and measured throughout the study area (Fig. 4). It should be noted that these values are considered the minimum runout lengths, as the bed termination may not be seen, and the outcrop might have a limited exposure. The bed thickness was measured as an absolute vertical thickness (Fig. 3) and the apparent bed dip was measured along the base of well-exposed sandstone beds rather than the recessively weathering siltstone and mudstone intervals, to improve the accuracy of the measurement.
Figure 3. Summarized VOM workflow. (A) Digitally measured sections (vertical black bar) were selected and assigned every 152 m along the length of one of the eight VOMs. Each bed intersected by the digitally measured section is given a unique number to correlate between adjacent digitally measured sections and to permit runout length measurements. (B) At each VOM digitally measured section, measurements and observations are taken at three vertical locations: the central log, and 5 m to the right and left. (C) Bed thickness and dip are measured. Grain size and lithofacies are identified for each bed in the central log and the logs 5 m to the left and right – three individual bed measurements are taken at each of the 60 locations. (D) The lithofacies identified in each digitally measured section are grouped into facies associations, these are mapped laterally through adjacent digitally measured sections. (E) Using the mapped facies associations, depositional maps of specific deltaic depositional cycles (i.e., parasequences) are reconstructed.
Field observations, thin section analysis, and published datasets (Newman & Chan, 1991; Howell et al., 2008a; Enge & Howell, 2010; Olariu et al., 2010; Forzoni et al., 2015) provide reasonable grain-size proxies for the facies and facies associations of the Panther Tongue outcrops, and thus were applied to the database based on interpreted facies. The metrics recorded within the VOM database include both quantitative data such as bed thickness, grain size, and bed length, as well as more qualitative assessments such as bed termination and amalgamation style. Two main types of bed terminations were observed: pinchouts and truncations. A bed pinchout was assigned when a bed thinned until it was no longer measurable or traceable, and a bed truncation was used when a bed was partially or entirely removed by an overlying bed. Details on whether beds amalgamate or bifurcate, were also recorded, including the bed identification numbers of the affected beds and the sense of direction (Fig. 3).
These data were used to calculate Net-to-Gross (NTG) estimates and depositional facies proportions throughout the study area. In addition, the beds measured in digital sections were grouped into facies associations, which were then used to identify stacking patterns, vertically and throughout the length of the study area. These results facilitated a reconstruction of delta lobe stacking throughout the study area.
4. Results
4.1. Facies Analysis
Lithofacies are defined by lithology, grain size, bed geometries, and similarities in characteristic sedimentary structures, etc. In total, seven lithofacies have been identified (F1-F7; Table 1; Fig. 4). F1 and F2 describe the more mudstone and siltstone-prone facies. F3 describes heterolithic deposits. F4-F7 describe the sandstone-prone facies; including structureless sandstone (F4), planar-bedded sandstone (F5), cross-bedded sandstone (F6), and medium-grained sandstone that contains mud rip-up clasts (F7).
| Lithofacies Name | Lithofacies Code | Bed Geometry | Description | Interpretation |
| Siltstones | F1 | Bed thickness:3-100 cm | Blue grey colored, structureless siltstone. Weathers recessively. See Figure 4A for photograph of F1 facies. | Deposits primarily as a result of settling from suspension, and may in part record the dilute components of turbidity currents |
| Mud- prone heterolithics | F2 | Bed thickness:2-200 cm | Structureless blue-grey siltstones punctuated by rare interbedded sandstones that have erosive bed bases. Sandstones grade normally upwards with parallel to current ripple cross-lamination. See Figure 4B for photograph of F2 facies. | Siltstone deposits primarily as a result of settling from suspension, and they may also record the upper , dilute components of turbidity currents . The normally graded and structured sandstone beds are a product of low - to medium- density turbidity currents . |
| Sand- prone heterolithics | F3 | Bed thickness:2-200 cm | Structureless siltstones interbedded with normally graded sandstone beds; overall F3 is more sand prone relative to F2. Sandstones are parallel to ripple laminated with erosive bed bases. See Figure 4C for photograph of F1 facies. | The normally graded and structured sandstone beds are a product of low - to medium- density turbidity currents , and the minor siltstone beds record the upper , dilute component of the turbidity currents , with a minor component resulting from suspension settling . The increase in sandstone content in F3 versus F2 suggests F3 is recording a more proximal position within the delta. |
| Very fine- to fine- grained sandstone | F4 | Bedthickness:25-400 cmBedlengths:8-2980 m | Bedded, predominantly structureless sandstones. See Figure 4D for photograph of F4 facies. | Sandstone beds are a product of turbidity currents . The thinner bedded sandstones beds are likely resulting from medium density turbidity flows, and the thicker bedded sandstones from high- density turbidity currents . |
| Fine- to medium- grained sandstone | F5 | Bedthickness:30-400 cmBedlengths:35-2985 m | Sandstone beds are planar laminated and laterally continuous with sharp bed contacts. Beds are locally amalgamated. See Figure 4E for photograph of F5 facies. | Planar lamination typical of upper phase flow regimes , possibly resulting from storms . They can also be the products of periodic turbididy currents that are instigated by storm reworking or hyperpycnal flows coming from the fluvial dominated delta. |
| Cross- bedded sandstone | F6 | Bedthickness:<100 cmBedlengths:135-1136 m | Sandstone beds are planar and cross laminated. Beds are tabular and laterally continuous. Erosive and amalgamated bed contacts are common. See Figure 4F for photograph of F6 facies. | The cross- bedding signals that the sandstone beds are the result of subaqueous dune migration. |
| Medium- grained sandstones with mudstone rip-up clasts | F7 | Bedthickness:2-11 cmBedlengths:73-427 m | Sandstone beds are frequently erosive, truncating underlying strata. The erosion surfaces are associated with mudstone rip-up clasts. See Figure 4G for photograph of F7 facies. | Sandstone beds and their erosive bases are associated with incision and highly erosive flows. Mudstone rip-up clasts are entrained through erosion of the underlying substrate by rip-up and scouring processes before being transported by traction beneath confined flows. |
Figure 4. Images showing the seven lithofacies observed in this study: (A-i) Siltstones (F1); (A-ii) A close-up image of the siltstone deposits that comprise F1; (B-i) Mud-prone heterolithics (F2); (B-ii) A close-up image of the mud-prone heterolithics that comprise F2; (C-i) Sand-prone heterolithics (F2); (C-ii) A close-up image of the sand-prone heterolithics that comprise F3; (D) Very fine- to fine-grained sandstone deposits (F4); (E) Fine- to medium-grained sandstone deposits (F5); (F) Cross-bedded sandstone (faint, low-angle laminations) (F6); (G) Medium-grained sandstones with mudstone rip-up clasts (F7).
The seven lithofacies were grouped into four facies associations (Fig. 5) that define and characterize specific deltaic sub-environments, from proximal to distal: distributary channel (FA1), proximal delta front (FA2), distal delta front (FA3), and prodelta (FA4) (see Fig. 5 for component lithofacies). These are consistent with previous interpretations of the Panther Tongue (Newman & Chan, 1991; Enge et al., 2010b; Olariu et al., 2010). They were mapped throughout the 13 km of VOMs, and have been included in the VOM metric database.
For the purposes of this study, the outcrop and thin section observations establish that grain size is predictable based on lithofacies and facies association and is therefore representative of the depositional environment. Overall, the transition from the most distal (prodelta) to the most proximal (distributary channel) setting is associated with a coarsening of grain size (from muddy siltstone to medium sandstone). An increase in sand bed thicknesses (from under 0.25 m to over 2 m) represents an increase in flow energy.
Figure 5. Composite log of the Panther Tongue of the Star Point Sandstone, showing the vertical distribution of the four Facies Associations identified in this study (from proximal to distal: FA1: Distributary Channel; FA2: Proximal Delta Front; FA3: Distal Delta Front; FA4: Prodelta), including summary descriptions, interpretations and outcrop photos capturing these facies associations in a vertical succession (FA2-FA4) and the outcrop of a distributary channel deposit at Sowbelly Gulch (FA1). The lithofacies that constitute each facies association are also listed (see Table 1 and Fig. 4 for details).
4.1.1. Facies Association 1: Distributary Channel (FA1)
FA1 description: FA1 is a sandstone-dominated succession composed of fine- to medium-grained sandstone beds that are 1-11 m thick; the maximum thickness intercepted by a digitally measured section for the database is 9.3 m (Figs. 5 and 6). Individual beds have a tabular to lenticular geometry. Structureless sandstone is most common, with sub-angular to rounded mudstone rip-up clasts present locally at bed bases, in association with basal erosion surfaces. Parallel lamination and cross-bedding are also present. Sandstone bed bases are a mix of amalgamated to erosive surfaces that truncate underlying deposits, locally by up to 3-4 m (Olariu et al., 2005; 2010). The type (and only) locality area for this facies association is Sowbelly Gulch (Figs. 1 and 6) at the western-most edge of the study area and the VOMs, where it was documented in detail by Olariu et al. (2005) and Olariu & Bhattacharya (2006). At Sowbelly Gulch, FA1 is expressed as a cliff-forming unit ~20 m thick and 200 m wide that is entirely composed of F6 and F7 (Table 1). The succession at this location has a lenticular geometry. This geometry and the dominance of FA1 might result from the outcrop exposure.
FA1 interpretation: The sand-prone, coarse-grained nature of FA1 and abundant concave-up erosion surfaces that locally downcut by up to 4 m, in association with mudstone rip-up clasts, are consistent with deposition in a dynamic, high energy, erosive, yet confined depositional setting. This confinement is further indicated by the overall lenticular geometry of the deposit. The presence of cross-bedded sandstone suggests sustained, unidirectional flow conditions that facilitated dune construction and migration (Allen, 1968; Harms et al., 1982; Southard & Boguchwal 1990; Best, 2005). The extreme thickness of the sandstone beds (up to a maximum of 11 m) is likely a consequence of amalgamation through the deposition of successive flood events (Olariu et al., 2005). These features are consistent with a terminal distributary channel (Olariu et al., 2005; 2010; Olariu & Bhattacharya, 2006; Martini & Sandrelli, 2015).
4.1.2. Facies Association 2: Proximal Delta Front (FA2)
FA2 description: FA2 is a sand-prone succession that is primarily composed of thick-bedded (2-4 m) fine-grained sandstone that locally includes medium-grained sandstone (Fig. 5). Beds typically have a tabular geometry and include structureless, planar laminated, and cross-bedded features. Bed bases are locally sharp and amalgamation surfaces are frequent. Siltstone intervals are rare in this facies association, and where they occur, they are present as thin, laterally discontinuous beds. Paleocurrent measurements indicate paleoflow to the southwest (Newman & Chan, 1991; Enge et al., 2010a; Olariu et al., 2010). FA2 has a sporadic and restricted trace fossil assemblage (BI = 0-2; MacEachern et al., 2005), that includes Ophiomorpha, Cylindrichnus, Diplocraterion, Arenicolites, Schaubcylindrichnus, Teredolites and escape structures (MacEachern et al., 2005). This facies association is observed throughout the study area but is more prevalent in the northern part and near the top of outcrop exposures.
FA2 interpretation: The thick-bedded nature of the sandstones in association with the amalgamation surfaces characteristic of FA2 are indicative of deposition from multiple, stacked flow events, indicative of fluctuating flow conditions (Reineck & Singh, 1980). The planar-laminated sandstones are characteristic of deposition under upper flow regime conditions, which in this case are likely the product of storm-induced flood stage runoff (Harms, 1975; Tunbridge, 1981; Stear, 1985; Bhattacharya et al., 2020). Similarly, the abundance of structureless sandstone implies rapid deposition from sediment-laden, high-density turbidity flows that undergo sudden changes in flow conditions (Lowe, 1982; Arnott & Hand, 1989; Martin & Turner, 1998; Mutti et al., 2000; Baas, 2004; Olariu et al., 2021). Such a scenario can occur when flows transition from the confinement of a river channel to a large body of water (such as a lake, ocean or seaway, i.e., at a delta) where they undergo flow expansion (Bates, 1953; Wright, 1977; Elliott, 1986), or during a flash flood event (Mutti et al., 2000). The cross-bedded sandstone records dune migration under sustained, unidirectional flow at low to moderate flow regimes (Allen, 1968; Harms et al., 1982; Southard & Boguchwal, 1990; Best, 2005). This interpretation along with evidence of storm deposition and evidence of flow transformation due to flow expansion, is suggestive of deposition in a proximal delta front setting. The paucity of finer-grained interbeds and the absence of biogenic features are consistent with very high sedimentation rates as well as constant freshwater runoff (Frey & Howard, 1985; Li et al., 2011; Bhattacharya et al., 2020). It is likely that the thin, laterally discontinuous, and lenticular interbedded siltstones accumulated during relatively quiet periods between depositional events (e.g., inter-flood stage), and/or waning flow conditions (Tunbridge, 1981; Steer, 1985; Mutti et al., 2000).
4.1.3. Facies Association 3: Distal Delta Front (FA3)
FA3 description: FA3 is a sand-prone succession composed of very fine- to fine-grained sandstone beds interbedded with siltstone beds, which are relatively thicker and more laterally continuous than those in FA2 (Fig. 5). The sandstone beds of FA3 are 20-200 cm thick, have a tabular geometry and are laterally continuous (some for hundreds of m) with limited vertical amalgamation. They are typically structureless or planar-laminated, although normally graded sandstone beds that contain an upward transition from structureless sandstone to planar lamination, to ripple lamination at the bed top are also common. These beds have sharp, typically erosive bases that locally contain tool marks indicating paleoflow to the southwest (Newman & Chan, 1991; Olariu et al., 2010). FA3 has more abundant biogenic structures (BI = 0-3; MacEachern et al., 2005), recording a proximal expression of Cruziana ichnofacies. MacEachern et al., (2005) noted the presence of Ophiomorpha, Thalassinoides, Skolithos, Paleophycus, Cylindrichnus, Rosselia, Arenicolites, Lockeia, Taenidium, Gyrochorte, Teichichnus, Schaubcylindrichnus, Teredolites and Fugichnia in many of the sandstone beds. The interbedded siltstone units are 5-50 cm thick, and are structureless to rippled. This facies association occurs throughout the entire study area and constitutes a significant proportion of the outcrops. FA3 is distinguished from FA4 based on the presence of more abundant and thicker sandstone beds.
FA3 interpretation: The sharp, erosive-based, normally-graded sandstones that exhibit an upwards transition of sedimentary structures from structureless to planar laminated to current ripple-cross laminated are turbidite deposits that exhibit incomplete Bouma sequences (i.e., Ta-Tc; Bouma 1962). These turbidite deposits are the products of periodic, hyperpycnal density currents or turbidity flows (Martinsen, 1990; Bhattacharya, 2006; Fielding, 2010; Ahmed et al., 2014; Bhattacharya et al., 2020). The relatively thin beds of this type are likely to represent a single event, and the thicker beds are considered the result of multiple, stacked and amalgamated events. The sediment gravity flow events that deposited these beds can occur due to the action of upstream (fluvial) flood events or through storm generation and reworking of previously deposited mouth bar and proximal delta front deposits. The intercalated siltstone may record background sedimentation such as fair-weather deposition from suspension between turbidite-generating events (Bhattacharya et al., 2020), or could in part represent the finer-grained, more dilute component of a turbidity flow event bed (Td and Te turbidite deposit) (Li et al., 2015). The moderately abundant, sporadic and diverse ichnoassemblages are consistent with the resumption of normal marine processes between storm events and the establishment of a benthic fauna during fairweather periods (Bhattacharya et al., 2020). This facies association is interpreted as the deposits of the distal delta front sub-environment.
4.1.4. Facies Association 4: Prodelta (FA4)
FA4 description: FA4 is primarily composed of grey siltstone with abundant, although sporadic bioturbation [BI = 1-3 (MacEachern et al., 2005); traces observed in the prodelta facies association by MacEachern et al., (2005), include Phycosiphon, Anconichnus/Phycosiphon, Helminthopsis, Ophiomorpha, Chondrites, Paleophycus, Asterosoma, Schaubcylindrichnus, MonocraterionandThalassinoides] that is interbedded with uncommon, thin (5-20 cm), very fine-grained sandstone beds that have a tabular geometry and are laterally continuous at outcrop. These sandstone beds increase in both occurrence and bed thickness up-section within FA4 (Fig. 5) and are typically structureless to ripple laminated. The interbedded siltstone beds range from centimeters to meters thick and have a massive, nodular appearance. This facies association is present throughout the study area towards the base of the Panther Tongue succession (Fig. 5) although it is most prevalent in the eastern outcrops (around Access; Fig. 2). It typically defines the base of the Panther Tongue and has a gradational contact with the underlying mudstones of the Mancos Shale.
FA4 interpretation: FA4 represents the finest-grained sediments of the Panther Tongue in the study area. The siltstone that constitutes the bulk of the facies association is interpreted to be the product of deposition from suspension. The planar lamination within the siltstone is interpreted to be a product of sedimentation from buoyant plumes (Bhattacharya & MacEachern, 2009), although it may also partly record deposition by dilute, low-density turbidity currents (Li et al., 2015). The mottled appearance of the sandstone locally is interpreted to result from intense burrowing by marine benthic fauna. The locations of these intervals are interpreted to reflect more aerobic and saline bottom waters, facilitating colonization and biogenic activity within the sediments (Martinson, 1990; Bhattacharya, 2006; Bhattacharya et al., 2020). The thin, interbedded sandstones were deposited by episodic, hyperpycnally-derived sediment gravity flows, which transported coarser-grained sediments into the depositional setting (Li et al., 2015; Fielding, 2010; Ahmed et al., 2014). This facies association is interpreted to be the prodelta where sedimentation is a mix of suspension fallout and periodic density currents.
Figure 6. Distributary channel outcrop image. (A) A strike-oriented photograph of the Panther Tongue sandstone at the western end of the field area. (B) Interpreted distributary channels showing truncation of sandstone beds (traced in white).
4.2. VOM Metric Database
A total of 508 sandstone beds were individually numbered and mapped out along the virtual outcrop model. Bed thickness was measured every time individual, laterally continuous beds were intercepted by a digitally measured section and its paired sections spaced 5 m to the left and right, resulting in over 2600 total measurements. The bed thickness values were used to calculate the bed thinning rate, which is a dimensionless unit that quantifies the change in bed thickness over the full length that the bed can be mapped at, at outcrop or in the VOM. Bed thickness data were also used to calculate the average sandstone bed thickness. For each of the 508 sandstone beds, the maximum bed thicknesses were noted in the database to reduce the possibility of skewing the average. To prevent longer beds from being over-represented in the database, the data were filtered to record only the thickest measurement per individual bed. The maximum bed thicknesses recorded in the database for a single sandstone bed ranges from 0.07 to 9.3 meters, with the thickest bed being recorded in FA1 at Sowbelly Gulch (Table 2). The maximum bed thicknesses can be further interrogated to display the distribution of the bed thicknesses. For example, there is a peak between 0.2 to 0.4 m thick, and over half the sandstone beds are less than 0.6 m thick with a median sandstone thickness of 0.48 m (Fig. 7).
| Metric | Average | Range | |
| Sandstone bed thickness (m) | 0,78 | 0.07 – 9.3 | |
| Siltstone unit thickness (m) | 0,81 | 0.63 – 10.2 | |
| Bed dip (˚) | 2,2 | 0.41 – 8.8 | |
| Minimum bed runout length (m) | 330 | 30 – 2930 | |
| Maximum bed runout length (m) | 290 | 40 – 1830 | |
| Bed Thinning Rates: | Large scale distance (>10 m) | 1.6 X 10⁻³ | - |
| Small scale distance (<10 m) | 1.2 X 10⁻² | - | |
| Net-to-Gross (NTG) | 0,65 | 0.23 – 0.97 | |
| Facies Associations Proportions | FA1 ( Distributary Channel) | 0,06 | 0 – 0.92 |
| FA2 (Proximal Delta Front) | 0,14 | 0 – 0.77 | |
| FA3 (Distal Delta Front) | 0,45 | 0 – 0.87 | |
| FA4 ( Prodelta ) | 0,35 | 0 – 0.93 | |
The bed runout length is herein defined as the entire traceable exposure of a bed from the down-dip bed termination to the up-dip termination. Although 508 sandstone beds were analyzed in this study, only 486 of these could be confidently mapped for their entire runout per this definition (Table 2 and the supplementary data file; Atlas et al., 2020a). Sandstone bed runout lengths range from 30 m to 2930 m, with an average of 330 m (Table 2; Fig. 7). These are considered the minimum bed runout lengths (Table 2), since many bed terminations are not visible in outcrop or VOM. When filtered to obtain the runout lengths where both the up-dip and down-dip terminations are observed, the sample size is reduced to 199 beds with bed runout length ranging from 40 m to 1830 m, with an average of 290 m (maximum bed runout lengths; Table 2).
Figure 7. Sandstone metrics derived from 60 VOM digitally measured sections. (A) Frequency plot displaying the maximum sand thickness. (B) Maximum sand thickness binned by outcrop from proximal (left) to distal (right) – SG = Sowbelly Gulch; GW = Gentile Wash; PP = Powerplant; SC = Spring Canyon; Co = Connector; HS = Hard Scrabble; FP = Fish Pond; Ac = Access (see Fig. 2 for locations). (C) Frequency plot displaying sandstone bed runout length. (D) Runout lengths binned by outcrop from proximal (left) to distal (right). (E) Sandstone thinning rates calculated over 10 m (orange) and measured runout length (dark blue). (F) Apparent bed dip binned by outcrop from proximal (left) to distal (right).
The sandstone bed thinning rates were calculated from the entire database of bed thickness measurements, and therefore document the change in bed thickness across the entire study area. There is a decrease in bed thickness from north to south along the depositional dip (Fig. 7), as predicted by deltaic depositional models (Bhattacharya, 2006; Suter, 2006). With the two scales of spacing, representing different orders of magnitude between the digitally measured sections in this study, it is possible to calculate two scales of thinning rates. The average small-scale (<10 m distance) thinning rate is 1.22x10⁻² and the average entire bed-scale thinning rate of 1.63x10⁻³. The relationship between the bed thickness and the bed thinning rate is poorly linear at the smaller scale (R2=0.42) and linear at the larger scale (R2=0.55) (Fig. 7). The thinning rates in more proximal deposits are larger relative to those observed for more distal outcrops (Fig. 8). This spatial trend is likely a consequence of rapid sand deposition in proximal areas due to flow expansion (Elliott, 1986; Arnott & Hand, 1989; Martin & Turner, 1998; Baas, 2004), with pronounced thinning distally as the sand volume in the flow decreases. In more distal areas, the beds are finer grained and the flows that transported the sediment had the carrying capacity to move them greater distances, resulting in beds that do not thin as rapidly. Thinning rates were also assessed along strike and depositional dip. The average bed thinning rate along strike is 1.37 x 10⁻², and the depositional dip thinning rate is 1.01 x 10⁻² (Fig. 8). This trend implies that sandstone beds thin equally in all directions from the sediment source, as it would be expected when the bulk of the sand is deposited in the most proximal areas.
Figure 8. Small-scale (<10 m) sandstone bed thinning rates. (A) Histogram showing the small-scale sandstone bed thinning rates by outcrop orientation from proximal (left) to distal (right), see Fig. 2 for outcrop locations. (B) Small-scale sandstone bed thinning rates grouped by outcrop orientation.
This database also contains quantitative data for the architecture of the heterolithic intervals and the siltstone-rich intervals between the sandstone beds. The average siltstone-prone interval is 0.81 m thick. However, this obscures the spatial trend in the thickness of the siltstones, as they increase in thickness from an average of 0.44 m in proximal areas to an average thickness of 1.4 m in distal areas (Fig. 9). Due to the low lithologic contrast of the siltstones, and the resolution of the VOMs, it was not possible to calculate the runout length, thinning rate, and dip data for siltstones and finer-grained deposits.
Outcrop orientation significantly impacts apparent bed dip measurements (Fig. 7). The average recorded bed dip is 2.2˚ which is comparable to the dip of delta front clinothems in other modern and ancient deltaic systems (Coleman, 1981; Balsey, 1983; Hampson, 2000; Olariu et al., 2010).
Figure 9. Siltstone metrics derived from the 60 VOM digitally measured sections. (A) Frequency plot of siltstone unit thickness. (B) Siltstone unit thickness binned by outcrop from proximal (left) to distal (right); see Fig. 2 for outcrop locations.
4.3. Spatial Variation
Figures 7, 8, and 9 illustrate the trends of decreasing sandstone bed thickness, increasing siltstone interval thickness, and increasing bed runout length from proximal to distal areas. The average sandstone bed thickness decreases from 2.3 m in the most proximal areas, to 0.34 m in the most distal sites (Table 3). The average bed runout lengths increase by 90% from 179 m to 340 m from proximal to distal areas. This increase in bed runout length in more distal areas is a result of the tendency for distal beds to remain isolated from each other, as a result of insufficient supply of sediment, whereas proximal beds are prone to amalgamation, due to a sufficient sediment supply.
The dataset documents significant changes in NTG and in the distribution of individual sub-environments when moving from proximal to distal areas. The most proximal deposit (SG; Table 3) has an average NTG value of 0.96, and is entirely composed of FA1 (85%) and FA2 (15%) facies associations (Table 3; Fig. 10). By comparison, the most distal deposits (Ac; Table 3) have a NTG of 0.37, and are dominated by FA3 (17%) and FA4 (77%) facies associations.
Table 3: .
| Metric | Outcrops ( from Proximal to Distal) | ||||||||
| SG | SC | HS | Co | GW | PP | FP | Ac | ||
| Distance to previous outcrop (m) | - | 4100 | 330 | 1390 | 835 | 445 | 975 | 950 | |
| Sandstone bed thickness (m) | 2,3 | 0,9 | 0,89 | 0,74 | 0,78 | 0,72 | 0,69 | 0,35 | |
| Siltstone unit thickness (m) | 0,46 | 0,44 | 0,64 | 0,44 | 0,54 | 0,47 | 1,4 | 1,1 | |
| Bed dip (˚) | 2,05 | 1,85 | 5,9 | 1,63 | 2,21 | 2,04 | 2,45 | 1,9 | |
| Sandstone Bed Runout Length (m) | 178,5 | 162,8 | 350,4 | 275,4 | 344,7 | 481,9 | 597,3 | 339,7 | |
| Bed Thinning Rate ( small-scale distance < 10m) | 0,0068 | 0,0013 | 0,012 | 0,013 | 0,011 | 0,012 | 0,0093 | 0,008 | |
| Net-to-Gross (NTG) | 0,96 | 0,86 | 0,58 | 0,77 | 0,7 | 0,8 | 0,55 | 0,37 | |
| Facies Associations Proportions | FA1 ( Distributary Channel) | 0,85 | 0 | 0 | 0 | 0 | 0 | 0 | 0 |
| FA2 (Proximal Delta Front) | 0,15 | 0,5 | 0,11 | 0,14 | 0,11 | 0,25 | 0,17 | 0,06 | |
| FA3 (Distal Delta Front) | 0 | 0,48 | 0,52 | 0,66 | 0,69 | 0,64 | 0,34 | 0,17 | |
| FA4 ( Prodelta ) | 0 | 0,02 | 0,37 | 0,2 | 0,2 | 0,11 | 0,49 | 0,77 | |
Figure 10. Spatial trends through the study area. Properties are calculated by outcrop and plotted through the study area to assess possible spatial trends. (A) NTG is represented with pie charts showing the percent sand (yellow) to percent silt (grey). (B) Sub-environment proportions present at VOM digitally measured section. Base maps are topographic maps from www.caltopo.com.
4.4. Temporal Delta Evolution – Delta Lobe Mapping
After compiling the VOM metric database, facies associations were identified and mapped at each of the 60 digitally measured sections to facilitate the reconstruction of the delta lobes in time and space. This method relies on facies and facies association identification and delineating deltaic stacking patterns (Figs. 3, 4 and 5). The depositional cycles defined within this study of the Panther Tongue are primarily upward coarsening and thickening sandstone successions bound by flooding surfaces. In deltaic sequence stratigraphic terms, these would be considered parasequences (sensu van Wagoner, 1988). However, as each depositional package is only partially preserved, the term cycle is preferred. The cycles were identified and numbered from the base of the most distal outcrop (see access location; Fig. 2), and correlated between all the outcrops in the study area for a total of 29 mappable depositional cycles.
Figure 11. VOM images showing specific interpreted delta cycles. (A) Map showing the area covered by VOM and highlighting the locations of the images shown in B-D (acronyms refer to outcrop names; see Fig. 2 for locations). Base map is from www.caltopo.com; (Bi) Uninterpreted image showing the Powerplant VOM Cycles 1 and 2; (Bii) Interpreted image showing the Powerplant VOM Cycles 1 and 2; (Ci) Uninterpreted image showing part of the northern Spring Canyon VOM that shows Cycle 4; (Cii) Interpreted image showing part of the northern Spring Canyon VOM that shows Cycle 4; (Di) Uninterpreted image showing a view of western Spring Canyon VOM showing Cycles 5 and 6. (Dii) Interpreted image showing a view of western Spring Canyon VOM showing Cycles 5 and 6.
The majority of the cycles were mapped independently on each side of Highway 6 because only four could be correlated with confidence across the road (Fig. 2). The variable orientations of the VOMs provided local three-dimensional control to calibrate the location of individual cycles at eight discrete time intervals (Figs. 11 and 12). These eight-time steps are considered representative of all 29 cycles identified, and they represent the most complete, the oldest, and the youngest cycles. The four cycles spanning the gap across Highway 6 were included and are located within the lower half of the Panther Tongue. The remaining four maps capture cycles within the upper, and therefore youngest, parts of the Panther Tongue, including the proximal deposits in Spring Canyon (Figs. 11 and 12).
The four oldest EOD maps (cycles 1-4; Fig. 12A-D) represent deposition in the northern part of the field area at the base of the Panther Tongue. They depict a series of depositional cycles (delta lobes) that preserve proximal to distal facies associations prograding from north to south. The geometry of the four delta lobes reflects a change in the degree of lateral expansion from oldest to youngest (cycles 1-4; Fig. 12A-D). The younger delta lobes were partially eroded by the transgressive ravinement event that truncates the top of the Panther Tongue (Hwang & Heller, 2002) (see red lines and transparent facies association colors in cycles 5-7; Fig 12E-G). Figure 12E-G depicts a transition from a north-south trajectory to one that is directed more to the southwest, as the delta lobes progressively stacked towards the west (Fig. 12I), probably as a result of lobe avulsion due to compensational stacking (Howell et al., 2008; Straub et al., 2009; Trampush et al., 2017). The EOD maps shown in Fig. 12F-G depict the continued southwestern migration of the delta lobes; however, they also record the impact of the later incision by the distributary channel complex at Sowbelly Gulch (Figs. 2; 5-6; 12H), which is shown to have incised into both of these delta cycles, removing the prodelta and distal delta front deposits locally (Fig. 12F-H). The composite map, shown in Figure 12I, illustrates the overall southwestward trajectory followed by a major southward progradation of the reconstructed delta lobes compiled onto a single map (Fig. 12I).
Figure 12. EOD maps for eight specific time-slice intervals. The black outline represents the modeled outcrop exposure and black dots show the locations of the digitally measured section. Maps (A-H) show eight distinct depositional cycles (1-8), from oldest to youngest, that have been mapped (on the VOMs) in detail to show the evolution of the Panther Tongue through time. Location names of main outcrop areas shown in A as SG = Sowbelly Gulch; GW = Gentile Wash; PP = Powerplant; SC = Spring Canyon; Co = Connector; HS = Hard Scrabble; FP = Fish Pond; Ac = Access (see Fig. 2 for locations). (I) Composite EOD map showing the locations of the eight reconstructed cycles (parasequences) that are stacked in depositional order, and the southerly directed progradation of the Panther Tongue. Base maps are from www.caltopo.com
5. Discussion
This study expands on and supplements previous studies of the Panther Tongue deltaic system by capturing the meso-scale internal architecture of this system via a new VOM workflow and derived metric database. The lithofacies and facies associations are interpreted to represent a low gradient, river-dominated, deltaic system, consistent with previous studies (Howard, 1966; Newman & Chan, 1991; Hwang & Heller, 2002; Enge et al., 2010b; Olariu et al., 2010; Hampson et al., 2011). The new EOD maps and better-constrained architectural interpretations of the deposits suggest some revised interpretations of the paleogeography, and a critical review of the utility of the Wax Lake delta as a modern analog.
5.1. Paleogeography
As a river-dominated deltaic system, the Panther Tongue is atypical of many other Cretaceous Western Interior Seaway strata in the region, including wave-dominated units like the Ferron Sandstone and the Aberdeen, Kenilworth, Grassy, and Sunnyside Members of the Blackhawk Formation (Hale & van der Graaf, 1964; Cotter, 1975; 1976; Ryer, 1993; 2004; Matheny & Picard, 1985; Ryer & Lovekin, 1986; Thompson et al., 1986; Gardner, 1995; Minor et al., 2022), and tide-dominated deltaic deposits such as the Frontier Formation and Sego Sandstone (Willis et al., 1999; Bhattacharya & Willis, 2001; Willis & Gabel, 2001; Willis, 2005). It is also relatively fine-grained with a narrow grain-size range, distinguishing it from some other regional Cretaceous deltaic systems (Willis et al., 1999; Bhattacharya & Davies, 2001; Ryer & Anderson, 2004; White et al., 2004; Fielding, 2010; 2015; Li et al., 2018). The southward progradation of Panther Tongue (Fig. 12) is also in contrast to the mostly eastward-stepping deltas and shoreface systems of the Western Interior Seaway (Ryer, 1981; Matheny & Picard, 1985; Willis and Gabel, 2001; Edwards et al., 2005; Fielding, 2010; Cappelle et al., 2018).
In the initial time steps (cycles 1-3; Fig. 12A-C), the delta lobes are interpreted to display a lobate morphology, where the length is equal to, or marginally greater than the width. This implies that sediment dispersal occurred in a radial pattern, consistent with observations from other river-dominated deltas, such as the Lafourche and Atchafalaya deltas (Bernard, 1965; Galloway, 1975; Elliott, 1977; van Heerden & Roberts, 1988; Bhattacharya, 2006; 2010; Olariu & Bhattacharya, 2006; Li et al., 2018; Chamberlain et al., 2018; Chun, 2021). The delta lobe morphology shown in the younger time steps (cycles 4-7; Fig 12D-G) records a subtle change in geometry with a larger width to length ratio, which can be suggestive of modification through deflection or wave energy (Li et al., 2015; Ainsworth et al., 2017; Shan et al., 2023). Given the absence of sedimentary structures indicative of wave energy such as wave ripple-lamination, hummocky, and swaley cross-stratification (Dott & Bourgeois, 1982; Chan & Dott, 1986; Hampson & Howell, 2005; 2017; Li et al., 2018). However, it is possible that this evolution in delta lobe morphology is an artifact resulting from the east-west trend of the outcrop exposure (e.g., Spring Canyon, Fig. 2). In addition, the interpreted distributary channel complex at Sowbelly Gulch (Fig. 12H) has removed part of the depositional record of the younger lobes (cycles 6 and 7; Fig 12F-G) through erosion and incision, resulting in a partial record of the width of these delta lobes. The incised distributary channel deposit further suggests that there was a significant progradation of the Panther Tongue to the south prior to the transgressive event that led to ravinement of the upper surface of the unit (cf. Hampson et al., 2011; Forzoni et al., 2015).
One partial exception to the generally eastward progradation of Cretaceous deltaic shorelines is the Notom Delta of the Ferron Sandstone, which prograded to the east but with a southward deflection due to a combination of storm wave and storm-reworking, coastal currents and longshore transport (Fielding, 2010; Li et al., 2011). Such a situation does not apply to the Panther Tongue because there is no evidence of major wave or storm influence that would be consistent with or facilitate along-shore reworking. The paleocurrent data establish that paleoflow was sustained to the southwest through each of the sub-environments in each lobe, with no major changes in transport direction (Newman & Chan, 1991; Olariu et al., 2010). Three scenarios have been proposed to account for the southward progradation of the Panther Tongue including: primarily longitudinal sediment transport, parallel with the Sevier orogen (Balsley, 1983), accumulation behind a north-south elongated structural to the east (Morris et al., 1995; Posamentier et al., 1995b), and accumulation behind a north-south oriented spit (Olariu et al., 2010).
Although the Sevier fold-thrust belt, the presumed source of the Panther Tongue delta, is typically mapped showing a strong N-S orientation feeding east-directed transverse drainages (Fig. 1), it is likely that local variations and lateral ramps occurred (DeCelles & Coogan, 2006). Therefore, it is possible that a north-south-oriented structural high or large spit could have been present during this time, acting to shield the Panther Tongue delta system from modification by wave action of the Western Interior Seaway basin, compelling the delta to prograde locally southward (Morris et al., 1995; Posamentier et al., 1995a; 1995b; Olariu et al., 2010). In this scenario, the Panther Tongue would be considered a bayhead delta that accumulated in a semi-enclosed embayment, protected from wave attack from the open seaway to the east (Aschoff et al., 2018; Simms et al., 2018). This hypothesis is consistent with all available data and provides a reasonable explanation for the preservation of a relatively small, fine-grained, southward prograding delta system in the otherwise wave- and tide-dominated N-S shoreline of the Western Interior Seaway.
5.2. Modern Analog Comparison
The icehouse climate conditions and lack of epeiric seaways in the modern world limits direct comparison of the Panther Tongue to modern equivalents. Based on its geometry and size (Fig. 13), the Panther Tongue is commonly compared to the modern, river-dominated Wax Lake delta on the coast of Louisiana, U.S.A. (Wellner et al., 2005; Olariu & Bhattacharya, 2006; Enge et al., 2010a; 2010b; Olariu et al., 2010). Like the Panther Tongue, there is little tide or wave modification evident in the deposits of the Wax Lake delta (Wellner et al., 2005; Edmonds & Slingerland, 2007, Falcini & Jerolmack, 2010; Edmonds et al., 2011; Shaw & Mohrig, 2014), although key boundary conditions such as the size of the drainage basin, distance from source terrain, and its position on a passive margin differ from those of the Campanian deposits. Physical sedimentary and biogenic processes appear to be generally similar between the two deltaic systems facilitating comparison between them. The Wax Lake delta has an average NTG of 67% (Roberts et al., 1997), accumulated directly on consolidated silty clay intercalated with shell layers, and is 1 to over 3 m thick (Wellner et al., 2005; Shaw et al., 2013). Like the Panther Tongue, the proximal part of the Wax Lake delta consists of sand deposits up to 3 m thick, with trough cross-bedding and/or structureless sand filling confined scours, while the distal deposits consisting of turbidite beds (Wellner et al., 2005).
Successive aerial imagery of the Wax Lake delta from 1983 to 2002, demonstrates how the delta has evolved through compensational stacking and southwards progradation of individual jet-plume deposits (bodies) (Wellner et al., 2005; Edmonds & Slingerland, 2007; Jerolmack & Swenson, 2007; Shaw & Mohrig, 2014; Shaw et al., 2016). These deposits were hierarchically arranged into jet deposits, jet deposit complexes, and delta scale elements by Wellner et al. (2005). Each jet deposit complex is approximately 1 to 4 km wide and 6 to 9 km long. Panther Tongue cycles (parasequences) have a similar width, but smaller length, perhaps as a result of the greater water depth of the Campanian seaway (Fig. 13). Significantly, the bodies comprising the Wax Lake delta are fed by a single, fixed proximal distributary channel with migrating, subaqueous terminal channels, incising and cannibalizing the subaqueous delta front and prodelta deposits (Weller et al., 2005; Shaw et al., 2013; 2016; Shaw & Mohrig, 2014). It is unknown if the interpreted distributary channels in the Panther Tongue converged at an apex representing the proximal distributary mouth, creating a radiating pattern as seen on the Wax Lake delta (Figs. 2, 6, 12F-H) and the lack of evidence for incision in most of the parasequences hinders comparison to the compensationally stacked deposits of the Wax Lake delta. Stacking in the modern delta is accomplished by progressively basinward migration and incision of the subaqueous, terminal distributary channels, leading to bifurcation of the channel and deposition of new bodies (Wellner et al., 2005, Fig. 37). The apparent absence of distributary channel deposits in the oldest parasequences of the Panther Tongue suggests that mechanisms of progradation and compensational stacking of this unit differed from those observed in the Wax Lake delta. With these differences in mind, the key similarities between the Wax Lake delta and ancient systems like the Panther Tongue delta can be used to provide an approximation of depositional timing and possibly morphodynamic relationships (Wellner et al., 2005; Olariu & Bhattacharya, 2006; Edmonds & Slingerland, 2007, Enge et al., 2010a; 2010b; Falcini & Jerolmack, 2010; Olariu et al., 2010; Edmonds et al., 2011; Shaw & Mohrig, 2014; Ainsworth et al., 2019), but caution is advised when attempting more direct comparisons between the two systems.
Figure 13. A comparison of the modern Wax Lake delta and the interpreted delta lobes of the ancient Panther Tongue. The Wax Lake delta base map is from NASA Earth Observatory (https://earthobservatory.nasa.gov/) and the subaqueous delta lobe interpretations is modified from Wellner et al., 2005. The base map for the Panther Tongue is from www.caltopo.com.
5.3. Reservoir Implications
In a subsurface dataset, a reservoir of similar thickness and areal extent to the Panther Tongue could be recorded as a single wavelet in 20-30 hz seismic images, similar to those illustrated by synthetic seismic sections created by Hodgetts and Howell (2000) for parasequences in the overlying Blackhawk Formation. In a series of cores and wireline logs, it might be possible to reconstruct a compensationally-stacked delta system composed of hyperpycnal beds that exhibit bed thinning and grain size fining along depositional dip, although this would be highly interpretive and unconstrained by necessary chronostratigraphic data. Analog-based constraints on the internal heterogeneity of these depositional systems can be provided by interrogating high-resolution outcrop data sets that have systematic and quantitative information on bed thicknesses, bed runout lengths, lateral and vertical connectivity, and NTG. The tight spacing of the digitally measured sections (152 m) in this methodology can potentially help predict and constrain intra- and inter-well heterogeneity. Throughout the 13 linear km of outcrops, both small-scale (<10 m) and study area-wide changes in average bed thicknesses were recorded, as was NTG, and siltstone unit thickness, all of which are potential baffles and barriers that may impact production (Miall, 1988; Knox & Barton, 1999; Nordhal & Ringrose, 2008; Enge & Howell, 2010; Howell et al., 2014; Puig et al., 2019).
Sandstone bed runout lengths can help to predict the decline in reservoir volume over specific distances where it is assumed that longer runout lengths indicate a more laterally extensive reservoir (Ringrose et al., 1999; Tőkés & Patacci, 2018). Of the 486 beds that could be mapped laterally with at least one bed termination, 199 of them record a full runout length with observed up-dip and down-dip bed terminations (maximum sandstone bed runout length; Table 2). For this reason, the NTG estimates and thinning rates calculated from the database (Tables 2 and 3) are considered to be the conservative lower limit proxies for the reservoir volume and lateral extent of beds.
The record of both small-scale (<10 m) and large-scale (>10 m) thinning rates (Fig. 3; Table 2) shows that bed thinning rates decrease by an order of magnitude when comparing the average bed thinning rate over a 10 m distance (1.2 x 10⁻²) to that over average bed thinning rate for the entire study area (1.6 x 10⁻³). In addition, these data also show that there is a decrease in bed thinning rate when comparing the most proximal to the most distal deposits, in response to facies variability. The beds within the distributary channel have short runout lengths (average = 178.5 m) and record a bed thinning rate of 0.16 from the channel axis to the channel margin (Olariu et al., 2005; 2010; Olariu & Bhattacharya, 2006). Although these beds are shorter, the prevalence of sandstone, in combination with erosion and amalgamation surfaces, results in a thick unit of vertically connected sandstone beds, with few, discontinuous siltstone breaks. In more distal environments, such as the distal delta front, the bed thinning rates are lower, which results in tabular, laterally continuous sandstone beds. However, these beds are intercalated with thick siltstone intervals. Therefore, there is much greater compartmentalization of the succession, resulting in little-to-no vertical connectivity between sandstone beds in more distal environments. Overall, the bed thinning data shows that there is no change in bed thinning rate relative to outcrop orientation, which suggests that the sandstone beds within the study area thin equally both laterally and longitudinally from the sediment source, implying that the reservoir thins radially in all directions, similar to the trend observed in modern, river-dominated deltas such as the Lafourche delta (Chamberlain et al., 2018; Chun, 2021).
Depending on the nature of the fluids, the diagenetic history, and the presence of fluid pathways such as faults and fractures, the reconstructed delta lobes derived from the mapping of the facies associations could be considered to represent the building blocks of individual flow units. Under the right conditions, the flow units could encompass multiple delta lobes, depending on the nature of bed contacts and the presence of fractures and faults. The lower four delta lobes reconstructed in the EOD maps in Figure 12 show that the proximal delta front deposits are located in the same relative location, which could represent areas of vertical connectivity between discrete delta lobes due to the nature of bed contacts and localized erosion. Similarly, the incision of the distributary channel into the younger delta lobe deposits, in association with its sand-prone infill, is likely to enhance and increase the connectivity between these lobes (Fig. 12).
5.3.1. Well Spacing Considerations
To test the value of the methodology presented here, an additional analysis was conducted to estimate reservoir heterogeneity using a more limited dataset with a spacing of 305 m or more between data points (e.g., twice the distance used in this study). The average bed runout length within the Panther Tongue is 330 m. At twice the current spacing of 152 m (e.g., 305 m), it is unlikely that two digitally measured sections (pseudo-wells) would penetrate the same individual sandstone bed. If by chance, two digitally measured sections intercepted the same sandstone bed at a 305 m spacing, the character of the bed in terms of facies, grain size and thickness of the bed over this distance would make it challenging to correlate without the ability to map out the individual beds. Furthermore, the bed would be stratigraphically lower and within a different sub-environment in the ‘down-dip well’ as a result of dipping clinothem architecture throughout the study area. However, it is highly likely that wells or digitally measured sections spaced at 305 m would intercept the same delta lobe, given the average delta lobe in the Panther Tongue is 1-4 km wide.
For this further analysis, a digitally measured section at the south end of Connector (Fig. 2) was selected as the central location of the study area, as it is proximal to several other outcrops (Fig. 14, Table 4). At this location, four stacked depositional cycles (parasequences) were identified in vertical section, each with a variable NTG, from 23% at the base to 91% at the top. The observations from the central location were then compared to seven digitally measured sections spaced 305 m away (twice current spacing) (Table 4): 305 m to the northeast, a digitally measured section records a vertical succession containing four stacked cycles, with a NTG that increases up-section from 54% to 80%. Similarly, 305 m to the south, a digitally measured section records four cycles with an upwards increasing NTG from 21% to 90%. At each of these locations, four cycles were identified. However, using just these data, it is not possible to establish if the same delta lobes are represented at each location.
Figure 14. (A) A map showing the locations used for NTG analysis and comparison at different digitally measured section spacing. Base map is from www.caltopo.com. (B) Digitally measured sections 1 and 2 are located 305 m away (twice the typical spacing of 152 m used in this study) from the main digitally measured section at Connector (shown in red), and digitally measured sections 3-6 are located 610 m away from the main digitally measured section at Connector (four times the typical spacing used in this study).
| Digital measured section number shown on Fig. 13 | MAIN section at Connector | 1 | 2 | 3 | 4 | 5 | 6 | |
| Distance from MAIN | - | 305 m | 305 m | 610 m | 610 m | 610 m | 610 m | |
| NTG by lobe | 1 ( lowest ) | 0,23 | 0,54 | 0,21 | 0,55 | 0,27 | 0,88 | 0,48 |
| 2 | 0,67 | 0,56 | 0,48 | 0,73 | 0,73 | 0,83 | 0,66 | |
| 3 | 0,54 | 0,55 | 0,78 | 0,65 | 0,94 | 0,87 | 0,58 | |
| 4 ( highest ) | 0,91 | 0,80 | 0,90 | 0,72 | 0,81 | - | 0,80 | |
| Average NTG - full log | 0,59 | 0,61 | 0,59 | 0,66 | 0,69 | 0,86 | 0,63 | |
To investigate possible field-scale variation further, the distance between digitally measured sections was increased to 610 m from the central digitally measured section (at Connector, Figs. 2 and 14, Table 4). In this analysis, a digitally measured section >610 m to the north contains four depositional cycles with an upwards increasing NTG from 55% to 72%. Similarly, 610 m south of the main location at Connector, a digitally measured section penetrates four cycles with a NTG that increases from 27% to 81%. A digitally measured section located 610 m to the east in Fishpond, records four cycles with an increasing NTG up-section from 48 to 80%. And finally, around 610 m to the west, three cycles are encountered which vary from 88% to 89% NTG up-section.
This exercise demonstrates that with little paleogeographic or chronostratigraphic context for the lobes, it is likely that four deltaic lobes will be intercepted at any location throughout the study area. In addition, the NTG increases up-section at all locations, which shows that vertical trends in NTG are not only diagnostic of depositional cycles, but are indicative of the prograding delta complex in general, masking the identity of individual cycles across the area. However, this analysis can be used to examine area-wide trends in NTG, as there is less variation in NTG towards the north, where it is higher, compared to the south where the variation is greater, and the values are lower. This could imply that tracking individual lobes throughout the area is less important to maximizing production than simply focusing on target areas with higher NTG.
6. Conclusions
UAV-based mapping and correlation of bed-scale heterogeneity, combined with systematic documentation of lithofacies, grain size, bed terminations, and other variables offer an efficient and accurate method to document and analyze outcrops, regardless of lithology, depositional environment, or geographic setting. This workflow uses a consistent spacing of sample locations to facilitate field-scale mapping, data collection, curation, analyses, and interrogation. Large amounts of quantitative and qualitative data can be effectively captured and used as analogs to inform predictive analyses of subsurface reservoir character, heterogeneity and compartmentalization, and ultimately to enhance utilization.
The seven lithofacies and four facies associations that were identified and mapped through 13 km of virtual outcrops formed the basis for construction of a series of eight EOD maps that reconstructed the migration of individual delta lobes over time. A database containing bed thickness values, grain size data, sedimentary structures, and bed contact style for each bed intercepted by 60 digitally measured sections, spaced at 152 m intervals, provides a robust data set to guide correlation in similar subsurface environments. Small-scale (<10 m) and the larger-scale (>10 m) lateral variation was evaluated via two infill measured sections spaced at 5 m to the left and right of each digitally measured section. The EOD maps, combined with the database demonstrate that stratal stacking patterns correlate to spatial trends in variables such as NTG, bed runout lengths, and bed thinning trends, consistent with observations from modern river-dominated deltas, such as the modern Wax Lake Delta on the Louisiana coast. Trends common to ancient deltaic systems like the Panther Tongue and outcrop analogs, in general, will be increasingly better documented and tested with data that are more efficiently and accurately collected by using the methods described in this paper.
Acknowledgements
This work would not be possible without the previous work and guidance from John Howell, Cornel Olariu, and others. Technical guidance and support were provided by Simon Buckley and Kari Ringdal from LIME VOG, and we thank WellCAD for academic licensing of software. This research was supported by ConocoPhillips and the University of Utah Geology and Geophysics department. Financial support also came from the Cooper Hansen Fellowship, Chevron Fellowship, and Dougan Fellowship in Fuels Technology. We also thank reviewers Xin Shan, Bhawanisingh G Desai, Executive Editor Murry Gingras and Associate Editor Ludvig Löwemark for their valuable comments and advice, which have improved this manuscript.
Data Availability
The database tables (https://doi.org/10.7278/S50D-40CY-RKF5) and all of the outcrop models (https://doi.org/10.7278/S50D-NJWS-R7TZ ) are available for download and citation.
Author contributions
Data acquisition, analysis and interpretation: C.E. Atlas. Additional interpretations, writing, drafting and revision: C.E. Atlas; E.A. Morris; C.J. Johnson; A.F.-J. Wroblewski. All authors have read and agreed to the published version of the manuscript.
References
Ahmed, S., Bhattacharya, J.P., Garza, D.E. & Li, Y. (2014) Facies Architecture and Stratigraphic Evolution of a River-Dominated Delta Front, Turonian Ferron Sandstone, Utah, USA. Journal of Sedimentary Research, 84(2), 97-121. https://doi.org/10.2110/jsr.2014.6 DOI: https://doi.org/10.2110/jsr.2014.6
Ainsworth, R.B., Vakarelov, B.K., Eide, C.H., Howell, J.A. & Bourget, J. (2019) Linking the high-resolution architecture of modern and ancient wave-dominated deltas: Processes, products, and forcing factors. Journal of Sedimentary Research, 89, 168-185. https://doi.org/10.2110/jsr.2019.7 DOI: https://doi.org/10.2110/jsr.2019.7
Ainsworth, R.B., Vakarelov, B.K., MacEachern, J.A., Rarity, F., Lane, T.I. & Nanson, R.A. (2017) Anatomy of a shoreline regression: implications for the high-resolution stratigraphic architecture of deltas. Journal of Sedimentary Research, 87, 425-459. https://doi.org/10.2110/jsr.2017.26 DOI: https://doi.org/10.2110/jsr.2017.26
Allen, J. (1968) Current ripples; Their relation to patterns of water and sediment motion. North-Holland Publishing Company, Amsterdam, 433pp.
Armstrong, R. (1968) Sevier orogenic belt in Nevada and Utah. GSA Bulletin, 79, 429-458. https://doi.org/10.1130/0016-7606(1968)79[429:SOBINA]2.0.CO;2 DOI: https://doi.org/10.1130/0016-7606(1968)79[429:SOBINA]2.0.CO;2
Arnott, R.W.C. & Hand, B.M. (1989) Bedforms, primary structures and grain fabric in the presence of suspended sediment rain. Journal of Sedimentary Petrology, 59, 1062-1069. https://doi.org/10.1306/212F90F2-2B24-11D7-8648000102C1865D DOI: https://doi.org/10.1306/212F90F2-2B24-11D7-8648000102C1865D
Aschoff, J., Olariu, C. & Steel, R. (2018) Recognition and significance of bayhead delta deposits in the rock record: A comparison of modern and ancient systems. Sedimentology, 65(1), 62-95. https://doi.org/10.1111/sed.12351 DOI: https://doi.org/10.1111/sed.12351
Atlas, C., Morris, E., & Johnson, C. (2020a). Dataset for: Panther Tongue - outcrop analog - metric database. https://doi.org/10.7278/S50D-40CY-RKF5
Atlas, C., Morris, E., & Johnson, C. (2020b). Dataset for: Panther Tongue virtual outcrop study - Model Files. https://doi.org/10.7278/S50D-NJWS-R7TZ
Aune, T. (2006) Reservoir Modelling of Delta Front Clinoforms within The Cretaceous Panther Tongue Formation, Western Interior Basin, USA. Master’s thesis, University of Bergen, Bergen, Norway, 124 pp.
Baas, J. (2004) Conditions for formation of massive turbiditic sandstones by primary depositional processes. Sedimentary Geology, 166, 293-310. https://doi.org/10.1016/j.sedgeo.2004.01.011 DOI: https://doi.org/10.1016/j.sedgeo.2004.01.011
Balsey, J. (1983) Cretaceous wave-dominated delta systems: Book Cliffs, East Central Utah, Oklahoma City Geological Society continuing education short course, Amoco Production Company, Denver, 1-219.
Bernard, H. A. (1965) A resume of river delta types. AAPG Bulletin, 49(3), 334-335. DOI: https://doi.org/10.1306/A663354A-16C0-11D7-8645000102C1865D
Best, J. (2005) The fluid dynamics of river dunes: A review and some future research directions. Journal of Geophysical Research, 110(F4), F04S02. https://doi.org/10.1029/2004JF000218 DOI: https://doi.org/10.1029/2004JF000218
Bhattacharya, J.P. (2006) Deltas. In: Posamentier, H. and Walker, R. (Eds.), Facies Models Revisited. SEPM Special Publication 84, 237–292. https://doi.org/10.2110/pec.06.84.0237 DOI: https://doi.org/10.2110/pec.06.84.0237
Bhattacharya, J.P. (2010) Deltas. In: Dalrymple, R.G. and James, N.P. (Eds.), Facies Models, Fourth Edition: Geological Association of Canada, Geotext 6, 233-264.
Bhattacharya, J.P. & Davies, R.K. (2001) Growth faults at the prodelta to delta-front transition, Cretaceous Ferron sandstone, Utah. Marine and Petroleum Geology, 18, 525-534. https://doi.org/10.1016/S0264-8172(01)00015-0 DOI: https://doi.org/10.1016/S0264-8172(01)00015-0
Bhattacharya, J.P. & MacEachern, J.A. (2009) Hyperpycnal rivers and prodeltaic shelves in the Cretaceous seaway of North America. Journal of Sedimentary Research, 79(4), 184-209. https://doi.org/10.2110/jsr.2009.026 DOI: https://doi.org/10.2110/jsr.2009.026
Bhattacharya, J.P., MacEachern, J.A., Garrison Jr., J.R., Ryer, T.A. & Pemberton, S.G. (2007) Integrated Sedimentology and Ichnology of Fluvial-Dominated and Wave Influenced Deltas in the Cretaceous Seaway: Ferron Sandstone and Panther Tongue, Utah. Field Trip Guidebook, SEPM Research Conference: Ichnological Applications to Sedimentological and Sequence Stratigraphic Problems, Price, Utah, May 20-26th, 2007, 115 pp.
Bhattacharya, J.P., Howell, C.D., MacEachern, J.A. & Walsh, J.P. (2020) Bioturbation, sedimentation rates, and preservation of flood events in deltas. Palaeogeography, Palaeoclimatology, Palaeoecology, 560, 110049. https://doi.org/10.1016/j.palaeo.2020.110049 DOI: https://doi.org/10.1016/j.palaeo.2020.110049
Bhattacharya, J.P. & Willis, B.J. (2001) Lowstand deltas in the Frontier Formation, Wyoming: Implications for sequence stratigraphic models. AAPG Bulletin, 85, 261-294. https://doi.org/10.1306/8626C7B7-173B-11D7-8645000102C1865D DOI: https://doi.org/10.1306/8626C7B7-173B-11D7-8645000102C1865D
Biber, K., Khan, S.D., Seers, T.D., Sarmiento, S. & Lakshmikantha, M.R. (2018) Quantitative characterization of a naturally fractured reservoir analog using a hybrid lidar-gigapixel imaging approach. Geosphere, 14(2), 710-730. https://doi.org/10.1130/GES01449.1 DOI: https://doi.org/10.1130/GES01449.1
Bouma, A. (1962) Sedimentology of some flysch deposits. A graphic approach to facies interpretation. Elsevier Publishing Company, New York, 168 pp.
Buckley, S., Ringdal, K., Naumann, N., Dolva, B., Kurz, T., Howell, J. & Dewez, T. (2019) LIME: Software for 3-D visualization, interpretation, and communication of virtual geoscience models. Geosphere, 15(1), 222-235. https://doi.org/10.1130/GES02002.1 DOI: https://doi.org/10.1130/GES02002.1
Buckley, S.J., Howell, J.A., Naumann, N., Lewis, C., Chmielewska, M., Ringdal, K., Vanbiervliet, J., Tong, B., Mulelid-Tynes, O.S., Foster, D., Maxwell, G. & Pugsley, J. (2022) L V3Geo: a cloud-based repository for virtual 3D models in geoscience. Geoscience Communication, 5, 67–82. https://doi.org/10.5194/gc-5-67-2022 DOI: https://doi.org/10.5194/gc-5-67-2022
Chamberlain, E.L., Törnqvist, T.E., Shen, Z., Mauz, B. & Willinga, J. (2018) Anatomy of Mississippi Delta growth and its implications for coastal restoration. Science Advances, 4, eaar4740. https://doi.org/10.1126/sciadv.aar4740 DOI: https://doi.org/10.1126/sciadv.aar4740
Chan, M.A. & Dott, R.H. Jr. (1986) Depositional Facies and Progradational Sequences in Eocene Wave-Dominated Deltaic Complexes, Southwestern Oregon. AAPG Bulletin, 70( 4), 415-429. https://doi.org/10.1306/94885723-1704-11D7-8645000102C1865D DOI: https://doi.org/10.1306/94885723-1704-11D7-8645000102C1865D
Chun, B. (2021) Modeling the Lafourche Delta network in the Mississippi Delta Complex, Unpublished MS Thesis, University of Arkansas, 64 pp.
Cotter, E. (1975) Late Cretaceous sedimentation in a low-energy coastal zone: the Ferron Sandstone of Utah. Journal of Sedimentary Petrology, 45, 669-685. https://doi.org/ 10.1306/212F6E0B-2B24-11D7-8648000102C1865D DOI: https://doi.org/10.1306/212F6E0B-2B24-11D7-8648000102C1865D
Cotter, E. (1976) The role of deltas in the evolution of Ferron Sandstone and its coals. Brigham Young University, Geology Studies, 22, 15–41.
Clark, F.R. (1928) Economic geology of the Castlegate, Wellington, and Sunnyside quadrangles, Carbon County, Utah. U.S. Geological Survey Bulletin, 793, 164 pp. https://doi.org/10.3133/b793 DOI: https://doi.org/10.3133/b793
Coleman, J. (1981) Deltas: processes of deposition and models for exploration. Burgess, CEPCO Division Minneapolis, 124 pp.
DeCelles, P.G. & Coogan, J.C. (2006) Regional structure and kinematic history of the Sevier fold-and-thrust belt, central Utah. GSA Bulletin, 118, 841-864. https://doi.org/10.1130/B25759.1 DOI: https://doi.org/10.1130/B25759.1
Dott, R.H. Jr. & Bourgeois, J. (1982) Hummocky stratification: significance of its variable bedding sequences. GSA Bulletin, 93, 663-680. https://doi.org/10.1130/0016-7606(1982)93<663:HSSOIV>2.0.CO;2 DOI: https://doi.org/10.1130/0016-7606(1982)93<663:HSSOIV>2.0.CO;2
Edmonds, D.A., Paola, C., Hoyal, D.C.J.D. & Sheets, B.A. (2011) Quantitative metrics that describe river deltas and their channel networks. Journal of Geophysical Research, 116, F04022. https://doi.org/10.1029/2010JF001955 DOI: https://doi.org/10.1029/2010JF001955
Edmonds, D. & Slingerland, R. (2007) Mechanics of river mouth bar formation: Implications for the morphodynamics of delta distributary networks. Journal of Geophysical Research, 112 F02034. https://doi.org/10.1029/2006JF000574 DOI: https://doi.org/10.1029/2006JF000574
Edwards, C., Howell, J. & Flint, S. (2005) Depositional and stratigraphic architecture of the Santonian Emery Sandstone of the Mancos Shale: Implications for Late Cretaceous evolution of the western interior foreland basin of central Utah, U.S.A. Journal of Sedimentary Research, 75(2), 280–299. https://doi.org/10.2110/jsr.2005.021 DOI: https://doi.org/10.2110/jsr.2005.021
Elliott, T. (1977) The variability of modern river deltas. Science Progress, 64(254), 215-227.
Elliott, T. (1986) Siliciclastic shorelines. In: Reading, H.G. (Ed.), Sedimentary environments and facies. Blackwell, Oxford, 155-188.
Enge, H., Buckley, S., Rotevatn, A. & Howell, J. (2007) From outcrop to reservoir simulation model: Workflow and procedures. Geosphere, 3(6), 469-490. https://doi.org/10.1130/GES00099.1 DOI: https://doi.org/10.1130/GES00099.1
Enge, H. & Howell, J. (2010) Impact of deltaic clinothems on reservoir performance: Dynamic studies of reservoir analogs from the Ferron Sandstone Member and Panther Tongue, Utah. AAPG Bulletin, 94(2), 139-161. https://doi.org/10.1306/07060908112 DOI: https://doi.org/10.1306/07060908112
Enge, H., Howell, J. & Buckley, S. (2010a) The geometry and internal architecture of stream mouth bars in the Panther Tongue and the Ferron Sandstone Members, Utah, USA. Journal of Sedimentary Research, 80(11), 1018-1031. https://doi.org/10.2110/jsr.2010.088 DOI: https://doi.org/10.2110/jsr.2010.088
Enge, H., Howell, J. & Buckley, S. (2010b) Quantifying clinothem geometry in a forced-regressive river-dominated delta, Panther Tongue Member, Utah, USA. Sedimentology, 57(7), 1750-1770. https://doi.org/10.1111/j.1365-3091.2010.01164.x DOI: https://doi.org/10.1111/j.1365-3091.2010.01164.x
Falcini, F. & Jerolmack, D.J. (2010) A potential vorticity theory for the formation of elongate channels in river deltas and lakes. Journal of Geophysical Research, 115, F04038. https://doi.org/10.1029/ 2010JF001802 DOI: https://doi.org/10.1029/2010JF001802
Fielding, C.R. (2010) Planform and facies variability in asymmetric deltas: Facies analysis and depositional architecture of the Turonian Ferron Sandstone in the western Henry Mountains, south-central Utah, USA. Journal of Sedimentary Research, 80(5-6), 455-479. https://doi.org/10.2110/jsr.2010.047 DOI: https://doi.org/10.2110/jsr.2010.047
Fielding, C.R. (2015) Anatomy of falling-stage deltas in the Turonian Ferron Sandstone of the western Henry Mountains Syncline, Utah: growth faults, slope failures, and mass transport complexes. Sedimentology, 62, 1-26. https://doi.org/10.1111/sed.12136 DOI: https://doi.org/10.1111/sed.12136
Frey, R. & Howard, J. (1985) Trace fossils from the Panther Member, Star Point Formation (Upper Cretaceous), Coal Creek Canyon, Utah. Journal of Paleontology, 59(1), 370-404.
Forzoni, A., Hampson, G. & Storms, J. (2015) Along-Strike variations in stratigraphic architecture of shallow-marine reservoir analogues: Upper Cretaceous Panther Tongue Delta and coeval shoreface, Star Point Sandstone, Wasatch Plateau, Central Utah, USA. Journal of Sedimentary Research, 85(8), 968-989. https://doi.org/10.2110/jsr.2015.69 DOI: https://doi.org/10.2110/jsr.2015.69
Galloway, W.E. (1975) Process framework for describing the morphologic and stratigraphic evolution of deltaic depositional systems. In: Broussard, M.L. (Ed.), Deltas, Models for Exploration. Houston Geological Society, 87-98.
Gardner, M.H. (1995) Tectonic and eustatic controls on the strata architecture of mid–Cretaceous stratigraphic sequences, central western interior foreland basin of North America. In: Dorobek, S.L., and Ross, G.M. (Eds.), Stratigraphic Evolution of Foreland Basins. SEPM Special Publication 52, 243-281. https://doi.org/10.2110/pec.95.52.0243 DOI: https://doi.org/10.2110/pec.95.52.0243
Hale, L. A. & F. R. Van de Graaff (1964) Cretaceous stratigraphy and facies patterns—northeastern Utah and adjacent areas. Intermountain Association of Petroleum Geologists 13th Annual Field Conference Guidebook, 115-138.
Hampson, G. (2000) Discontinuity surfaces, clinoforms, and facies architecture in a wave-dominated, shoreface-shelf parasequence. Journal of Sedimentary Research, 70 (no. 2), 325-340. https://doi.org/10.1306/2DC40914-0E47-11D7-8643000102C1865D DOI: https://doi.org/10.1306/2DC40914-0E47-11D7-8643000102C1865D
Hampson, G., Gani, M., Sharman, K., Irfan, N. & Bracken, B. (2011) Along-strike and down-dip variations in sequence stratigraphic architecture: Upper Cretaceous Star Point Sandstone, Wasatch Plateau, central Utah, USA. Journal of Sedimentary Research, 81, 159-184. https://doi.org/10.2110/jsr.2011.15 DOI: https://doi.org/10.2110/jsr.2011.15
Hampson, G.J. & Howell, J.A. (2005) Sedimentologic and geomorphic characterization of ancient wave-dominated deltaic shorelines: Upper Cretaceous Blackhawk Formation, Book Cliffs, Utah, U.S.A. In: Giosan, L. and Bhattacharya, J.P. (Eds.), River Deltas— Concepts, Models, and Examples, SEPM Special Publication 83, 133-154. https://doi.org/10.2110/pec.05.83.0131 DOI: https://doi.org/10.2110/pec.05.83.0131
Hampson, G.J. & Howell, J.A. (2017) Sedimentologic and sequence stratigraphic characteristics of wave-dominated deltas. AAPG Bulletin, 101(4), 441-451. https://doi.org/10.1306/011817DIG17023 DOI: https://doi.org/10.1306/011817DIG17023
Hampson, G.J., Rodriguez, A.B., Storms, J.E.A., Johnson, H.D. & Meyer, C.T. (2008) Geomorphology and high-resolution stratigraphy of progradational wave-dominated shoreline deposits: impact on reservoir-scale facies architecture. In: Hampson, G.J., Steel, R.J., Burgess,M. and Dalrymple, R.W. (Eds.), Recent Advances in Models of Siliciclastic Shallow-Marine Stratigraphy. SEPM Special Publication 90, 117-142. https://doi.org/10.2110/pec.08.90.0117 DOI: https://doi.org/10.2110/pec.08.90.0117
Hampson, G.J. & Storms, J.E.A. (2003) Geomorphological and sequence stratigraphic variability in wave-dominated, shoreface–shelf parasequences. Sedimentology, 50, 667-701. https://doi.org/10.1046/j.1365-3091.2003.00570.x DOI: https://doi.org/10.1046/j.1365-3091.2003.00570.x
Harms, J., Southard, J., Spearing, D. & Walker, R. (1975) Depositional environments as interpreted from primary sedimentary structures and stratification sequences. SEPM Short Course no. 2. https://doi.org/10.2110/scn. 75.02 DOI: https://doi.org/10.2110/scn.75.02
Harms, J., Southard, J. & Walker, R. (1982) Structures and sequences in clastic rocks. SEPM Short Course no. 9. https://doi.org/10.2110/scn.82.09 DOI: https://doi.org/10.2110/scn.82.09
Howard, J. (1966) Upper Cretaceous Panther Sandstone Tongue of east-central Utah, its sedimentary facies and depositional environments. Ph.D. dissertation, Brigham Young University, Provo, Utah, 216 pp.
Howell, J.A. & Burnham, B.S. (2021) The Virtual Geoscience Revolution: From William Smith to Virtual Outcrop [preprint - EarthArXiv]. https://doi.org/10.31223/X5MS66 DOI: https://doi.org/10.31223/X5MS66
Howell, J.A., Chmielewska, M., Lewis, C., Buckley, S.J., Naumann, N. & Pugsley J. (2021) Acquisition of Data for Building Photogrammetric Virtual Outcrop Models for the Geosciences using Remotely Piloted Vehicles (RPVs), [preprint - EarthArXiv]. https://doi.org/10.31223/X54914 DOI: https://doi.org/10.31223/X54914
Howell, J.A., Eide, C.H. & Hartley, A. (2018) No evidence for sea level fall in the Cretaceous strata of the Book Cliffs of Eastern Utah, [EarthArXiv preprint]. https://doi.org/10.31223/osf.io/2ju3d DOI: https://doi.org/10.31223/OSF.IO/2JU3D
Howell, J.A. & Flint, S.S. (2004) Tectonic setting, stratigraphy and sedimentology of the Book Cliffs. In: Coe, A.L. (Ed.), The Sedimentary Record of Sea-Level Change. Cambridge University Press, Cambridge, UK. 135-157.
Howell, J.A., Martinius, A.W. & Good, T.R. (2014) The application of outcrop analogues in geological modelling: a review, present status and future outlook. In: Martinius, A.W., Howell, J.A. and Good, T.R. (Eds.), Sediment-Body Geometry and Heterogeneity: Analogue Studies for Modelling the Subsurface. Geological Society, London, Special Publication 387, 1-25. https://doi.org/10.1144/SP387.12 DOI: https://doi.org/10.1144/SP387.12
Howell, J., Vassel, Å. & Aune, T. (2008a), Modelling of dipping clinoform barriers within deltaic outcrop analogues from the Cretaceous Western Interior Basin, USA. Geological Society, London, Special Publication 309, 99-121. https://doi.org/10.1144/SP309.8 DOI: https://doi.org/10.1144/SP309.8
Howell, J., Skorstad, A., Macdonald, A., Fordham, A., Flint, S., Fjellvoll, B. & Manzocchi, T. (2008b) Sedimentological parameterization of shallow-marine reservoirs. Petroleum Geoscience, 14(1), 17-34. https://doi.org/10.1144/1354-079307-787 DOI: https://doi.org/10.1144/1354-079307-787
Hwang, I. & Heller, P. (2002) Anatomy of a transgressive lag: Panther Tongue Sandstone, Star Point Formation, central Utah. Sedimentology, 49(5), 977-999. https://doi.org/10.1046/j.1365-3091.2002. 00486.x DOI: https://doi.org/10.1046/j.1365-3091.2002.00486.x
Irving, E. (1979), Paleopoles and paleolatitudes of North America and speculations about displaced terrains. Canadian Journal of Earth Sciences, 16, 669-694. https://doi.org/10.1139/e79-065 DOI: https://doi.org/10.1139/e79-065
Jerolmack, D. J. & Swenson, J.B. (2007) Scaling relationships and evolution of distributary networks on wave-influenced deltas. Geophysical Research Letters, 34, L23402. https://doi.org/10.1029/2007GL031823 DOI: https://doi.org/10.1029/2007GL031823
Kamola, D. & Van Wagoner, J.W. (1995) Stratigraphy and facies architecture of parasequences with examples from the Spring Canyon Member, Blackhawk Formation, Utah. In: Van Wagoner, J.C. and Bertram, G.T. (Eds.), Sequence Stratigraphy of Foreland Basin Deposits – Outcrops and Subsurface examples from the Cretaceous of North America. AAPG Memoir 64, 27-54. https://doi.org/10.1306/M64594C3 DOI: https://doi.org/10.1306/M64594C3
Kuuskraa V.A. & Ammer J. (2004) Tight gas sands development—how to dramatically improve recovery efficiency . GasTIPS Gas Technology Institute Report, 15-20.
Knox, P.R. & Barton, M.D. (1999) Predicting interwell heterogeneity in fluvial-deltaic reservoirs: effects of progressive architecture variation through a depositional cycle from outcrop and subsurface observations. In: R. Schatzinger and J. Jordan (Eds.), Reservoir Characterization-Recent Advances. AAPG Memoir 71, 57-72. https://doi.org/10.1306/M711C5 DOI: https://doi.org/10.1306/M711C5
Lawton, T.F. & Bradford, B.A. (2011) Correlation and provenance of Upper Cretaceous (Campanian) fluvial strata, Utah, USA, from zircon U-Pb geochronology and petrography. Journal of Sedimentary Research, 81(7), 495-512. https://doi.org/10.2110/jsr.2011.45 DOI: https://doi.org/10.2110/jsr.2011.45
Li, L., Walstra, D.-J. & Storms, J.E.A. (2015) The Impact of Wave-Induced Longshore Transport on a Delta–Shoreface System. Journal of Sedimentary Research, 85(1), 6-20. https://doi.org/10.2110/jsr.2014.95 DOI: https://doi.org/10.2110/jsr.2014.95
Li, W., Bhattacharya, J.P., Zhu, Y., Garza, D. & Blankenship, E. (2011) Evaluating delta asymmetry using three-dimensional facies architecture and ichnological analysis, Ferron ‘Notom Delta’, Capital Reef, Utah, USA. Sedimentology, 58(2), 478-507. https://doi.org/10.1111/j.1365-3091.2010.01172.x DOI: https://doi.org/10.1111/j.1365-3091.2010.01172.x
Li, Y., Bhattacharya, J.P., Ahmed, S. & Garza, D. (2018) Re-evaluating the paleogeography of the river-dominated and wave-influenced Ferron Notom Delta, southern central Utah: An integration of detailed facies-architecture and paleocurrent analysis. Journal of Sedimentary Research, 88, 214-240. https://doi.org/10.2110/jsr.2018.9 DOI: https://doi.org/10.2110/jsr.2018.9
Li, Z., Bhattacharya, J.P. & Schieber, J. (2015) Evaluating along-strike variation using thin-bedded facies analysis, Upper Cretaceous Ferron Notom Delta, Utah. Sedimentology, 62(7), 2060-2089. https://doi.org/10.1111/sed.12219 DOI: https://doi.org/10.1111/sed.12219
Lowe, D.R. (1982) Sediment gravity flows: II. Depositional models with special reference to deposits of high-density turbidity currents. Journal of Sedimentary Petrology, 52, 279-297. https://doi.org/10.1306/212F7F31-2B24-11D7-8648000102C1865D DOI: https://doi.org/10.1306/212F7F31-2B24-11D7-8648000102C1865D
MacEachern, J.A., Bann, K.L., Bhattacharya, J.P. & Howell, Jr., C.D. (2005) Ichnology of deltas: organism responses to the dynamic interplay of rivers, waves, storms and tides. In: Giosan, L. and Bhattacharya, J.P. (Eds.), River Deltas – Concepts, models and examples. SEPM Special Publication 83, 49-85. https://doi.org/10.2110/pec.05.83.0049 DOI: https://doi.org/10.2110/pec.05.83.0049
Marques Jr., A., Horota, R.K., de Souza, E.M., Kupssinskü, L., Rossa, P., Aires, A.S., Bachi, L., Veronez, M.R., Gonzaga Jr., L. & Cazarin, C.L. (2020) Virtual and digital outcrops in the petroleum industry: A systematic review. Earth-Science Reviews, 208, 103260. https://doi.org/10.1016/j.earscirev.2020.103260 DOI: https://doi.org/10.1016/j.earscirev.2020.103260
Martini, I. & Sandrelli, F. (2015) Facies analysis of a Pliocene river-dominated deltaic succession (Siena Basin, Italy): Implications for the formation and infilling of terminal distributary channels. Sedimentology, 62(1), 234-265. https://doi.org/10.1111/sed.12147 DOI: https://doi.org/10.1111/sed.12147
Martinsen, O. (1990) Fluvial, inertia-dominated deltaic deposition in the Namurian (Carboniferous) of northern England. Sedimentology, 37(6), 1099-1113. https://doi.org/10.1111/j.1365-3091.1990. tb01848.x DOI: https://doi.org/10.1111/j.1365-3091.1990.tb01848.x
Matheny, J. & Picard, M. (1985) Sedimentology and depositional environments of the Emery Sandstone Member of the Mancos Shale, Emery and Sevier counties, Utah. The Mountain Geologist, 22(3), 94-109. DOI: https://doi.org/10.31582/rmag.mg.22.3.94
Miall, A. (1988) Reservoir heterogeneities in fluvial sandstones: Lessons from outcrop studies. AAPG Bulletin, 72(6), 682-697. https://doi.org/10.1306/703C8f01-1707-11D7-8645000102C1865D DOI: https://doi.org/10.1306/703C8F01-1707-11D7-8645000102C1865D
Miall, A. (2015) Updating uniformitarianism: stratigraphy as just a set of ‘‘frozen accidents’’. In: Smith, D.G., Bailey, R.J., Burgess, P.M. and Fraser, A.J., (Eds.), Strata and Time: Probing the Gaps in Our Understanding. Geological Society, London, Special Publication 404, 11-36. https://doi.org/10.1144/SP404.4 DOI: https://doi.org/10.1144/SP404.4
Minor, K., Wroblewski, A.F.-J., Steel, R.J., Olariu, C. & Crabaugh, J.P. (2022) Facies partitioning of fluvial, wave, and tidal influences across the shoreline-to-shelf architecture in the Western Interior Campanian Seaway, USA. Geological Society, London, Special Publications 523, 487-523. https://doi.org/10.1144/SP523-2022-11 DOI: https://doi.org/10.1144/SP523-2022-11
Morris, W.R., Posamentier, H.W., Bhattacharya, J.P., Loomis, K.B., Kupecz, J.A., Wu, C., Lopez Blanco, M., Thompson, P.R., Spear, D.B. & Kendall, B. (1995) Panther Tongue sandstone outcrop case study II: Evolution of delta types within a forced regression [abs]. AAPG Annual Meeting Abstracts, 4, p. 68A. https://doi.org/10.1306/7834EF43-1721-11D7-8645000102C1865D DOI: https://doi.org/10.1306/7834EF43-1721-11D7-8645000102C1865D
Mutti, E, Tinterri, R., di Biase, D., Fava, L., Mavilla, N., Angella, S. & Calabrese, L. (2000) Delta-front facies associations of ancient flood-dominated fluvio-deltaic systems. Revista de la Sociedad Geológica de España, 13 (2), 165-190.
Newman, K. & Chan, M. (1991) Depositional facies and sequences in the upper Cretaceous Panther Tongue member of the Star Point Formation, Wasatch Plateau, Utah. In: Chidsey, T.C. (Ed.), Geology of east-central Utah. Utah Geological Association, 19, 65-75.
Nordhal, K. & Ringrose, P.S. (2008) Identifying the representative elementary volume for permeability in heterolithic deposits using numerical rock models. Mathematical Geoscience, 40(7), 753-771. https://doi.org/10.1007/s11004-008-9182-4 DOI: https://doi.org/10.1007/s11004-008-9182-4
O’Byrne, C.J. & Flint, S. (1995) Sequence, parasequences and intrasequence architecture of the Grassy Member, Blackhawk Formation, Book Cliffs, Utah, U.S.A. In: Van Wagoner, J.C. and Bertram, G.T. (Eds.), Sequence Stratigraphy of Foreland Basin Deposits – Outcrops and Subsurface examples from the Cretaceous of North America. AAPG Memoir 64, 225-256. https://doi.org/10.1306/M64594C8 DOI: https://doi.org/10.1306/M64594C8
Olariu, C. & Bhattacharya, J.P. (2006) Terminal distributary channels and delta front architecture of river-dominated delta systems. Journal of Sedimentary Research, 76(2), 212-233. https://doi.org/10.2110/jsr.2006.026 DOI: https://doi.org/10.2110/jsr.2006.026
Olariu, C., Bhattacharya, J.P., Xu, X. Aiken, C.L.V., Zeng, X. & McMechan, G.A. (2005) Integrated study of ancient delta-front deposits, using outcrop, ground-penetrating radar, and three-dimensional photorealistic data: Cretaceous Panther Tongue Sandstone, Utah, USA. In: Giosan, L. and Bhattacharya, J.P. (Eds), River Deltas – Concepts, models and examples. SEPM Special Publication 83, 155-177. https://doi.org/10.2110/pec.05.83.0155 DOI: https://doi.org/10.2110/pec.05.83.0155
Olariu, C., Steel, R.J. & Petter, A.L. (2010) Delta-front hyperpycnal bed geometry and implications for reservoir modeling: Cretaceous Panther Tongue delta, Book Cliffs, Utah. AAPG Bulletin, 94(6), 819-845. https://doi.org/10.1306/11020909072 DOI: https://doi.org/10.1306/11020909072
Olariu, C., Zhou, C., Steel, R., Zhang, Z., Yuan, X., Zhang, J., Chen, S., Cheng, D. & Kim, W. (2021) Controls on the stratal architecture of lacustrine delta successions in low-accommodation conditions. Sedimentology, 68(5), 1941-1963. https://doi.org/10.1111/sed.12838 DOI: https://doi.org/10.1111/sed.12838
Posamentier, H.W, Morris, W.R., Bhattacharya, J.P., Kupecz, J.A., Loomis, K.B., Lopez-Blanco, M., Wu, C., Kendall, B., Landis, C.R., Spear, D.B. & Thompson, P.R. (1995a) Cretaceous Panther Tongue sandstone outcrop case study I: regional sequence stratigraphic analysis [abs]. AAPG Annual Meeting Abstracts, 4, p. 77A. https://doi.org/10.1306/7834F141-1721-11D7-8645000102C1865D DOI: https://doi.org/10.1306/7834F141-1721-11D7-8645000102C1865D
Posamentier, H.W., Morris, W.R. & Bhattacharya, J.P. (1995b) The Panther Tongue Sandstone, Utah—an example of a forced regression deposit. In: Swift, D.J.P., Snedden, J.W. and Plint, A.G. (Eds.), Tongues, Ridges and Wedges. SEPM Research Conference, Powder River and Bighorn Basins, Wyoming, 70-73.
Posamentier, H.W. & Morris, W.R. (2000) Aspects of the stratal architecture of forced regressive deposits. Geological Society, London, Special Publications 172(1), 19-46. https://doi.org/10.1144/GSL.SP.2000.172.01.02 DOI: https://doi.org/10.1144/GSL.SP.2000.172.01.02
Pranter, M.J. Vargas, M.F. & Davis, T.L. (2008) Characterization and 3D reservoir modelling of fluvial sandstones of the Williams Fork Formation, Rulison Field, Piceance Basin, Colorado, USA. Journal of Geophysical Engineering, 5(2), 158-172. https://doi.org/10.1088/1742-2132/5/2/003 DOI: https://doi.org/10.1088/1742-2132/5/2/003
Puig, J.M., Cabello, P., Howell, J. & Arbués, P. (2019) Three-dimensional characterisation of sedimentary heterogeneity and its impact on subsurface flow behaviour through the braided-to-meandering fluvial deposits of the Castissent Formation (late Ypresian, Tremp-Graus Basin, Spain). Marine and Petroleum Geology, 103, 661-680. https://doi.org/10.1016/j.marpetgeo.2019.02.014 DOI: https://doi.org/10.1016/j.marpetgeo.2019.02.014
Reineck, H. & Singh, I. (1980) Depositional sedimentary environments with reference to terrigenous clastics. Springer-Verlag, New York, 549. DOI: https://doi.org/10.1007/978-3-642-81498-3
Ringrose, P., Pickup, G., Jensen, J. & Forrester, M. (1999) The Ardross Reservoir Gridblock Analog: Sedimentology, Statistical Representivity, and Flow Upscaling. In: R. Schatzinger and J. Jordan (Eds.), Reservoir Characterization-Recent Advances. AAPG Memoir 71, 265-276. https://doi.org/10.1306/M711C18 DOI: https://doi.org/10.1306/M711C18
Roberts, H., Walker, N., Cunningham, R. Kemp, G. & Majersky, S. (1997) Evolution of sedimentary architecture and surface morphology: Atchafalaya and Wax Lake Deltas, Louisiana (1973–1994). Gulf Coast Association, Geological Society Transactions, 47, 477-484.
Robinson Roberts, L.N. & Kirschbaum, M.A. (1995) Paleogeography of the Late Cretaceous of the Western Interior of Middle North America, coal distribution and sediment accumulation, U.S. Geological Survey Professional Paper 1561, 120. https://doi.org/10.3133/pp1561 DOI: https://doi.org/10.3133/pp1561
Robinson, R.A.J. & Slingerland, R.L. (1998) Grain-size trends, basin subsidence and sediment supply in the Campanian Castlegate Sandstone and equivalent conglomerates of central Utah. Basin Research, 10, 109-127. https://doi.org/10.1046/j.1365-2117.1998.00062.x DOI: https://doi.org/10.1046/j.1365-2117.1998.00062.x
Ryer, T.A. (1981) Deltaic coals of Ferron Sandstone Member of Mancos Shale: Predictive model for Cretaceous coal-bearing strata of Western Interior. AAPG Bulletin, 65(11), 2323-2340. https://doi.org/10.1306/03B59990-16D1-11D7-8645000102C1865D DOI: https://doi.org/10.1306/03B59990-16D1-11D7-8645000102C1865D
Ryer, T.A. (1993) Speculations on the origins of mid-Cretaceous clastic wedges, central Rocky Mountain region, United States. In: Caldwell, W.G.E. and Kauffman, E.G. (Eds.), Evolution of the Western Interior Basin. Geological Association of Canada, Special Paper 39, 189-198.
Ryer, T.A. (2004) Previous Studies of the Ferron Sandstone. In: Chidsey, T.C., Adams, R.D. and Morris, T.H. (Eds.), Regional to Wellbore Analog for Fluvial–Deltaic Reservoir Modeling: The Ferron Sandstone of Utah. AAPG Studies in Geology 50, 1-38. https://doi.org/10.1306/St50983 DOI: https://doi.org/10.1306/St50983C1
Ryer, T.A. & Anderson, P.B. (2004) Facies of the Ferron Sandstone, east-central Utah. In: Chidsey, T.C., Adams, R.D. and Morris, T.H. (Eds.), Regional to Wellbore Analog for Fluvial–Deltaic Reservoir Modeling: The Ferron Sandstone of Utah. AAPG Studies in Geology 50, 59-78. https://doi.org/10.1306/St50983 DOI: https://doi.org/10.1306/St50983C3
Ryer, T.A. & Lovekin, J.R. (1986) The Upper Cretaceous Vernal delta of Utah; depositional or paleotectonic feature? In: Peterson, J.A. (Ed.), Paleotectonics and sedimentation in the Rocky Mountain region, United States, Part III, Middle Rocky Mountains. AAPG Memoir 41, 497-510. https://doi.org/10.1306/M41456C24 DOI: https://doi.org/10.1306/M41456C24
Shaw, J.B. & Mohrig, D. (2014) The importance of erosion in distributary channel network growth, Wax Lake Delta, Louisiana, USA. Geology, 42(1), 31-34. https://doi.org/10.1130/G34751.1 DOI: https://doi.org/10.1130/G34751.1
Shaw, J.B., Mohrig, D. & Wagner, R.W. (2016) Flow patterns and morphology of a prograding river delta. Journal of Geophysical Research, 121, 372-391. https://doi.org/10.1002/2015JF003570 DOI: https://doi.org/10.1002/2015JF003570
Shaw, J.B., Mohrig, D. & Whitman, S.K. (2013) The morphology and evolution of channels on the Wax Lake Delta. Journal of Geophysical Research, 118, 1562-1584. https://doi.org/10.1002/jgrf.20123 DOI: https://doi.org/10.1002/jgrf.20123
Simms, A., Rodriguez, A. & Anderson, J. (2018) Bayhead deltas and shorelines: Insights from modern and ancient examples. Sedimentary Geology, 374, 17-35. https://doi.org/10.1016/j.sedgeo.2018.07.004 DOI: https://doi.org/10.1016/j.sedgeo.2018.07.004
Southard, J. & Boguchwal, L. (1990) Bed configurations in steady unidirectional water flows. Part 2. Synthesis of flume data. Journal of Sedimentary Petrology, 60(5), 658-679. https://doi.org/10.1306/212F9241-2B24-11D7-8648000102C1865D DOI: https://doi.org/10.1306/212F9241-2B24-11D7-8648000102C1865D
Spieker, E. & Reeside, J. (1925) Cretaceous and Tertiary formations of the Wasatch Plateau, Utah. GSA Bulletin, 36(3), 435-454. https://doi.org/10.1130/GSAB-36-435 DOI: https://doi.org/10.1130/GSAB-36-435
Stear, W. (1985) Comparison of the bedform distribution and dynamics of modern and ancient sandy ephemeral flood deposits in the southwestern Karoo region, South Africa. Sedimentary Geology, 45(3-4), 209-230. https://doi.org/10.1016/0037-0738(85)90003-X DOI: https://doi.org/10.1016/0037-0738(85)90003-X
St. Pierre, G.A.E. & Johnson, C.L. (2022) Challenging assumptions of sediment routing in retroarc foreland basins: Detrital zircon evidence for axial versus transverse drainages in the Late Cretaceous of southern Utah, USA. Basin Research, 34, 1960-1982. https://doi.org/10.1111/bre.12692 DOI: https://doi.org/10.1111/bre.12692
Straub, K.M., Paola, C., Mohrig, D., Wolinsky, M.A. and George, T. (2009) Compensational stacking of channelized sedimentary deposits. Journal of Sedimentary Research, 79, 673-688. https://doi.org/10.2110/jsr.2009.070 DOI: https://doi.org/10.2110/jsr.2009.070
Suter, J.R. (2006) Facies Models Revisited: Clastic Shelves. In Posamentier, H.W. and Walker, R.G., Facies Models Revisited. SEPM Special Publication 84, 339-398. https://doi.org/10.2110/pec.06.84.0339 DOI: https://doi.org/10.2110/pec.06.84.0339
Thomas, H., Brigaud, B., Blaise, T., Saint-Bezar, B., Zordan, E., Zeyen, H., Andrieu, S., Vincent, B., Chirol, H., Portier, E. & Mouche, E. (2021) Contribution of drone photogrammetry to 3D outcrop modeling of facies, porosity, and permeability heterogeneities in carbonate reservoirs (Paris Basin, Middle Jurassic). Marine and Petroleum Geology, 123, 104772. https://doi.org/10.1016/j.marpetgeo.2020.104772 DOI: https://doi.org/10.1016/j.marpetgeo.2020.104772
Thompson, S.L., Ossian, C.R. & Scott, A.J. (1986) Lithofacies, inferred processes, and log response characteristics of shelf and shoreface sandstones, Ferron Sandstone, central Utah. In: Moslow, T.F. and Rhodes, E.G. (Eds.), Modern and Ancient Shelf Clastics: A Core Workshop. SEPM Core Workshop 9, 325-361. https://doi.org/10.2110/cor.86.01.0325 DOI: https://doi.org/10.2110/cor.86.01.0325
Tőkés, L. & Pataccis, M. (2018) Quantifying tabularity of turbidite beds and its relationship to the inferred degree of basin confinement. Marine and Petroleum Geology, 97, 659-671. https://doi.org/10.1016/j.marpetgeo.2018.06.012 DOI: https://doi.org/10.1016/j.marpetgeo.2018.06.012
Trampush, S.M., Hajek, E.A., Straub, K.M. & Chamberlin, E.P. (2017) Identifying autogenic sedimentation in fluvial-deltaic stratigraphy: Evaluating the effect of outcrop-quality data on the compensation statistic. Journal of Geophysical Research, 122, 91-113. https://doi.org/10.1002/2016JF004067 DOI: https://doi.org/10.1002/2016JF004067
Tunbridge, I. (1981) Sandy high-energy flood sedimentation—some criteria for recognition, with an example from the Devonian of SW England. Sedimentary Geology, 28(2), 79-95. https://doi.org/10.1016/0037-0738(81)90058-0 DOI: https://doi.org/10.1016/0037-0738(81)90058-0
Usman, M., Siddiqui, N.A., Zhang, S.-Q., Mathew, M.J., Zhang, Y.-X., Jamil, M., Liu, X.-L. & Ahmed, N. (2021) 3D geo-cellular static virtual outcrop model and its implications for reservoir petrophysical characteristics and heterogeneities. Petroleum Science, 18(5), 1357-1369. https://doi.org/10.1016/j.petsci.2021.09.021 DOI: https://doi.org/10.1016/j.petsci.2021.09.021
Van Heerden, I.L. & Roberts, H.H. (1988) Facies development of Atchafalaya delta, Louisiana: a modern bayhead delta. AAPG Bulletin, 72, 439-453. https://doi.org/10.1306/703C8EB1-1707-11D7-8645000102C1865D DOI: https://doi.org/10.1306/703C8EB1-1707-11D7-8645000102C1865D
Van Wagoner, J.C., Posamentier, H.W., Mitchum, R.M., Vail, P.R., Sarg, J.F., Loutit, T.S. & Hardenbol, J. (1988) An overview of the fundamentals of sequence stratigraphy and key definitions. In: Wilgus, C.K., Hastings, B.S., Posamentier, H.W., Van Wagoner, J.C., Ross, C.A. and Kendall, C.G. (Eds.), Sea-Level Changes: An Integrated Approach. SEPM Special Publication 42, 39-46. https://doi.org/10.2110/pec.88.01.0039 DOI: https://doi.org/10.2110/pec.88.01.0039
Wellner, R., Beaubouef, R., Van Wagoner, J.C., Roberts, H. & Sun, T. (2005) Jet-plume depositional bodies - The primary building blocks of Wax Lake Delta. Gulf Coast Association of Geological Societies Transactions, 55, 867-909.
White, C.D., Willis, B.J., Dutton, S.P., Bhattacharya, J.P. & Narayanan, K. (2004) Sedimentology, statistics, and flow behavior for a tide-influenced deltaic sandstone, Frontier Formation, Wyoming, USA. In: Grammer, G.M., Harris, P.M. and Eberli, G.P. (Eds.), Integration of Outcrop and Modern Analogs in Reservoir Modeling. AAPG Memoir 80, 129-152. https://doi.org/10.1306/M80924C7 DOI: https://doi.org/10.1306/M80924C7
Willis, B.J. (2005) Deposits of tide-influenced river deltas. In: Giosan, L. and Bhattacharya, J.P. (Eds), River Deltas – Concepts, models and examples. SEPM Special Publication 83, 87-129. https://doi.org/10.2110/pec.05.83.0087 DOI: https://doi.org/10.2110/pec.05.83.0087
Willis, B.J., Bhattacharya, J.P., Gabel, S.L. & White, C.D. (1999) Architecture of a tide-influenced delta in the Frontier Formation of central Wyoming. Sedimentology, 46, 667-688. https://doi.org/10.1046/j.1365-3091.1999.00239.x DOI: https://doi.org/10.1046/j.1365-3091.1999.00239.x
Willis, B.J. & Gabel, S.L. (2001) Sharp-based, tide-dominated deltas of the Sego Sandstone, Book Cliffs, Utah, U.S.A. Sedimentology, 48, 479-506. https://doi.org/10.1046/j.1365-3091.2001.00363.x DOI: https://doi.org/10.1046/j.1365-3091.2001.00363.x
Young, R.G. (1955) Sedimentary interfacies and intertonguing in the Upper Cretaceous of the Book Cliffs, Utah-Colorado. GSA Bulletin, 66, 177-201. https://doi.org/10.1130/0016-7606(1955)66[177:SFAIIT]2.0.CO;2 DOI: https://doi.org/10.1130/0016-7606(1955)66[177:SFAIIT]2.0.CO;2
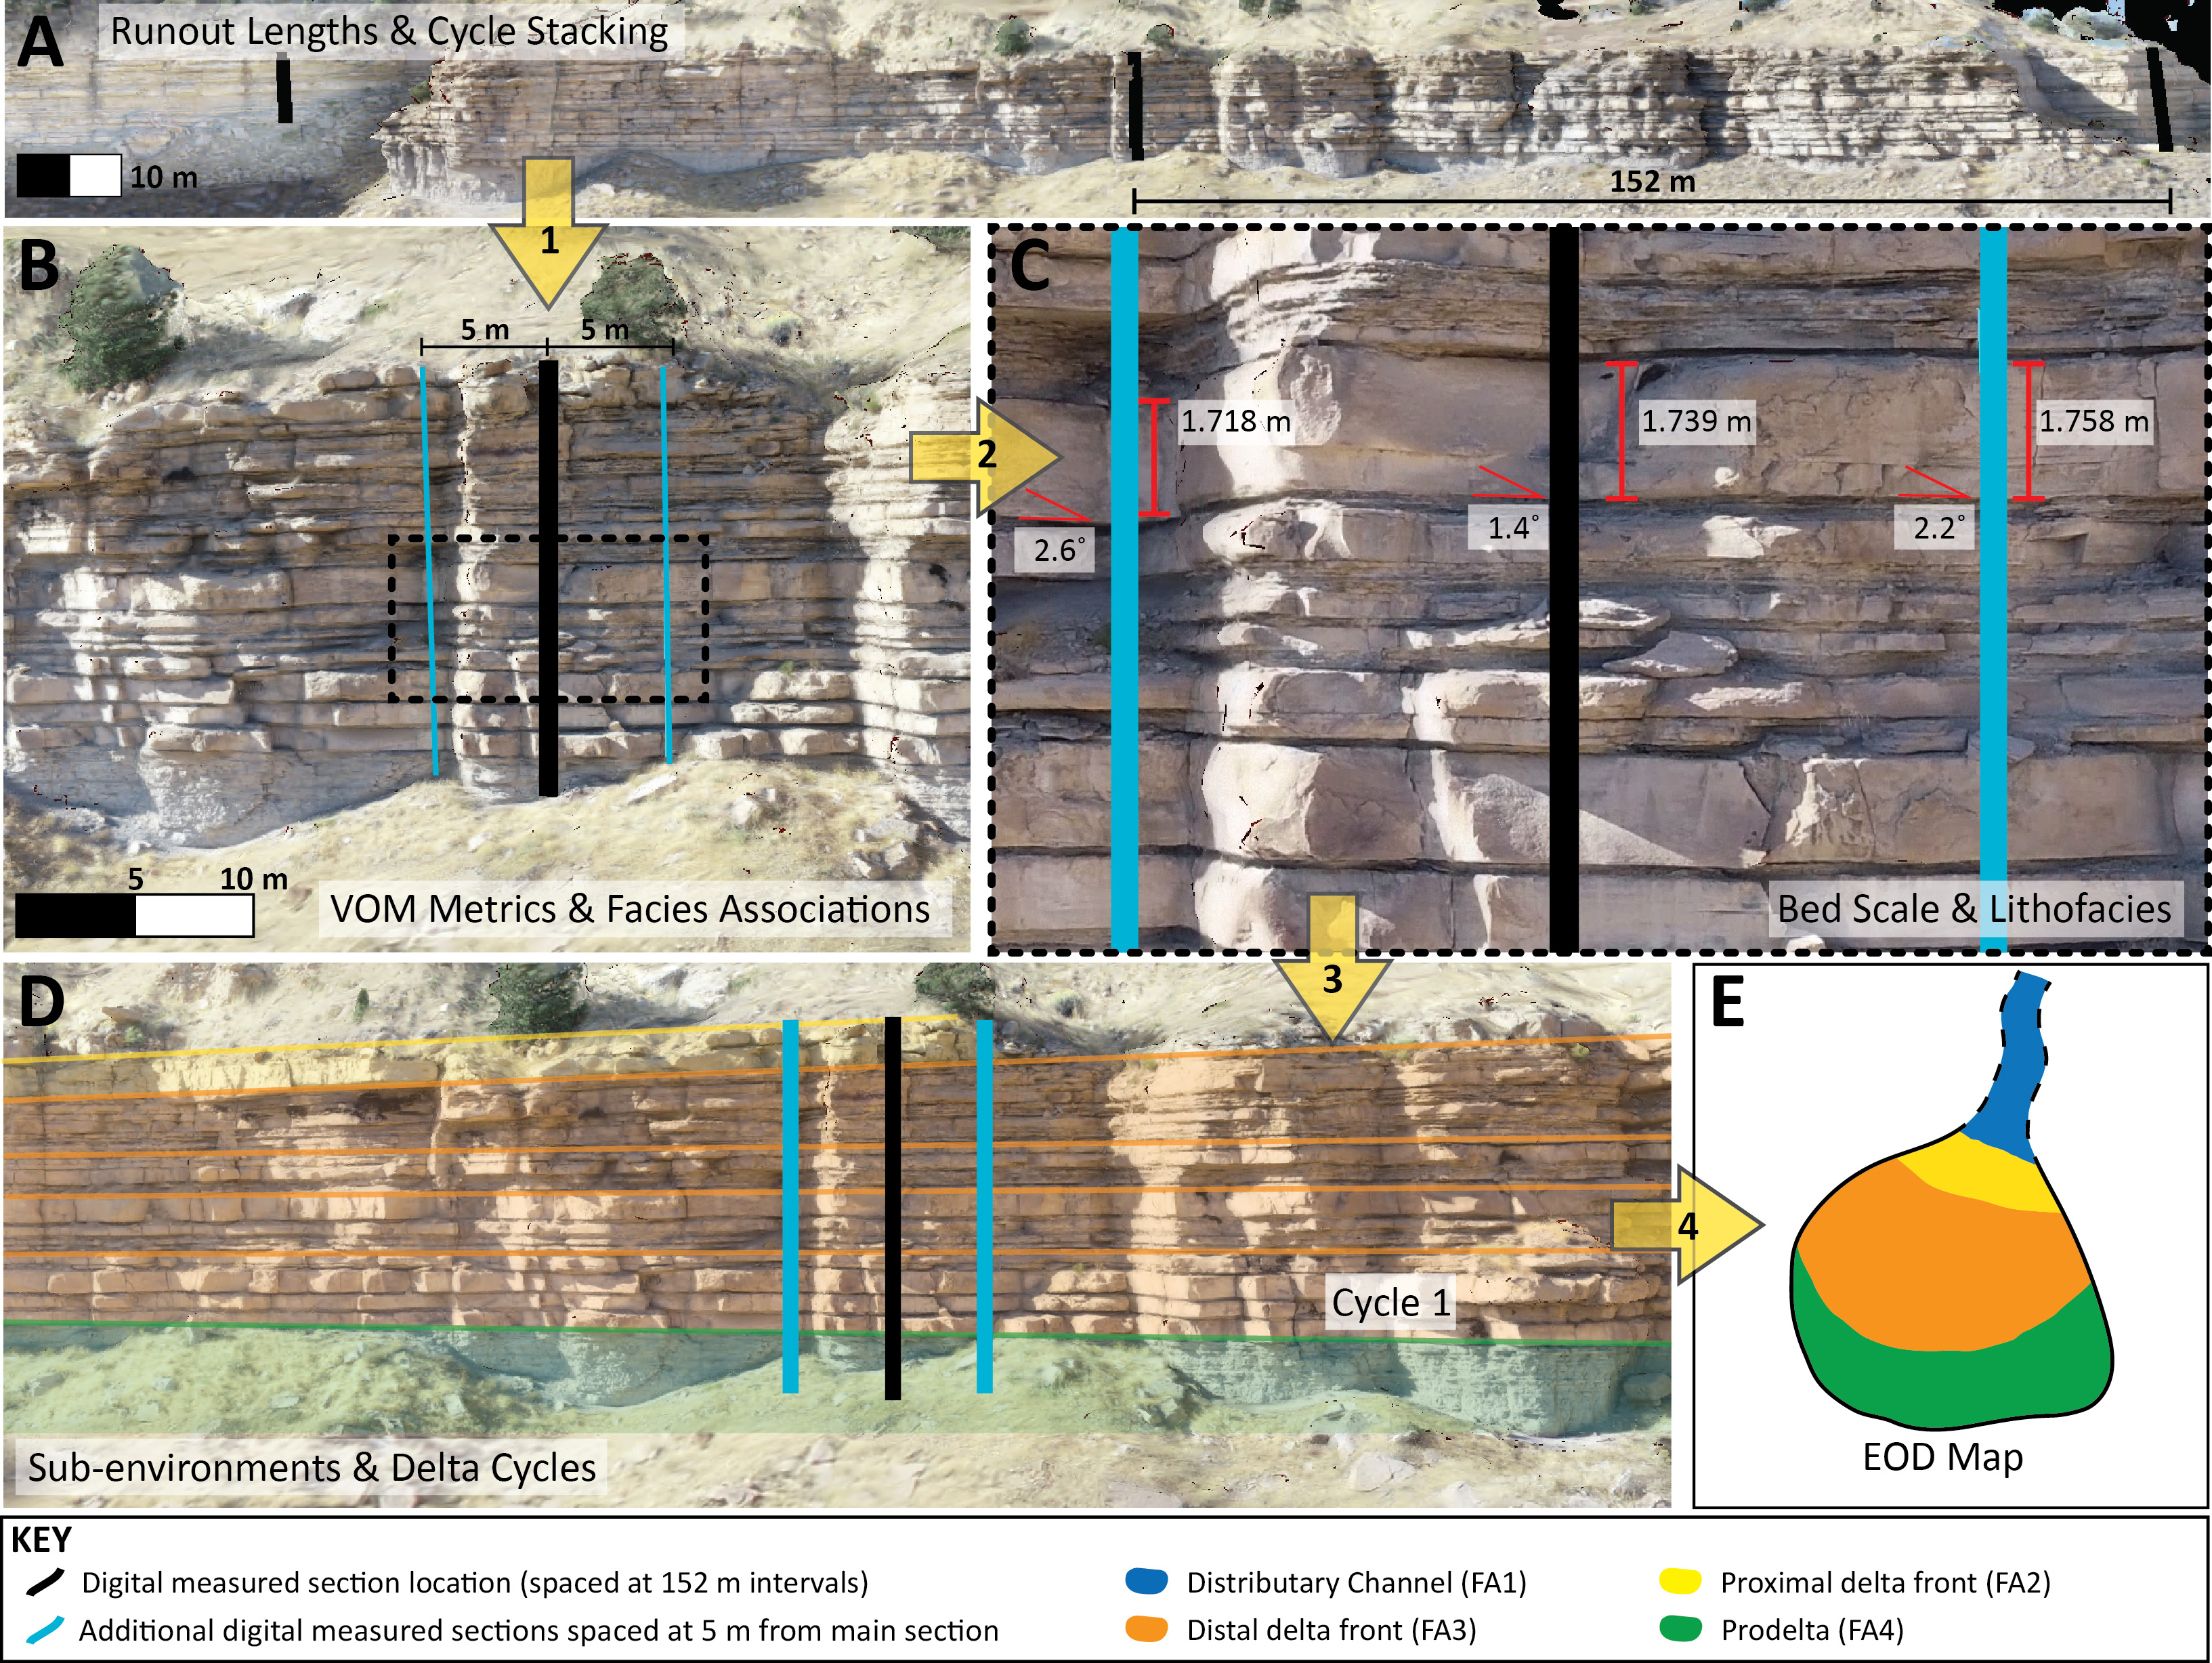
Downloads
How to Cite
License
Some rights reserved 2023 Claire E. Atlas, Emma A. Morris, Cari L. Johnson, Anton F.-J. Wroblewski

This work is licensed under a Creative Commons Attribution 4.0 International License.